
Issue 8: Disembodiment
One, Two, Many: Visualizing Tragedy at Scale
The coronavirus struck at a moment coincident with a massive rise in computing power, the availability of expansive datasets and the proliferation of modeling software tools. In newsrooms and academic settings all over the world it is the information designers who are on the front lines of communicating the impact of the crisis, as we struggle to understand the unseeable, and grapple with the barrage of pandemic-related numbers thrust upon us.
Charts, graphs, and maps are the lingua franca we have to help us grapple with the barrage of pandemic-related numbers being thrust upon us in this age of Covid-19. Data visualizations have, for the most part, been effective in keeping us informed of the virus’ impact and scale.
And, with almost a year of practice, we have become fluent in understanding that data. But, with that familiarity and fluency, are we becoming numb to the human story behind the data? Could a downside to the ease of interpreting this data and its escalating tallies, be an increasing disconnect between the data and the tragedy the numbers represent?
Media and academic information design departments spent the first months of the pandemic undertaking the daunting task of sourcing credible data, filling huge information gaps and wrestling the numbers into consistent, usable formats. Data dashboards were designed that, for the most part, use the known formats of charts and graphs that have served us well for over 150 years. As the pandemic continues, , these dashboards, like the one below, have evolved to serve as scoreboards for the latest news and trends. These scorecards fulfill the essential need to provide accurate tallies, but they do not offer the full story.
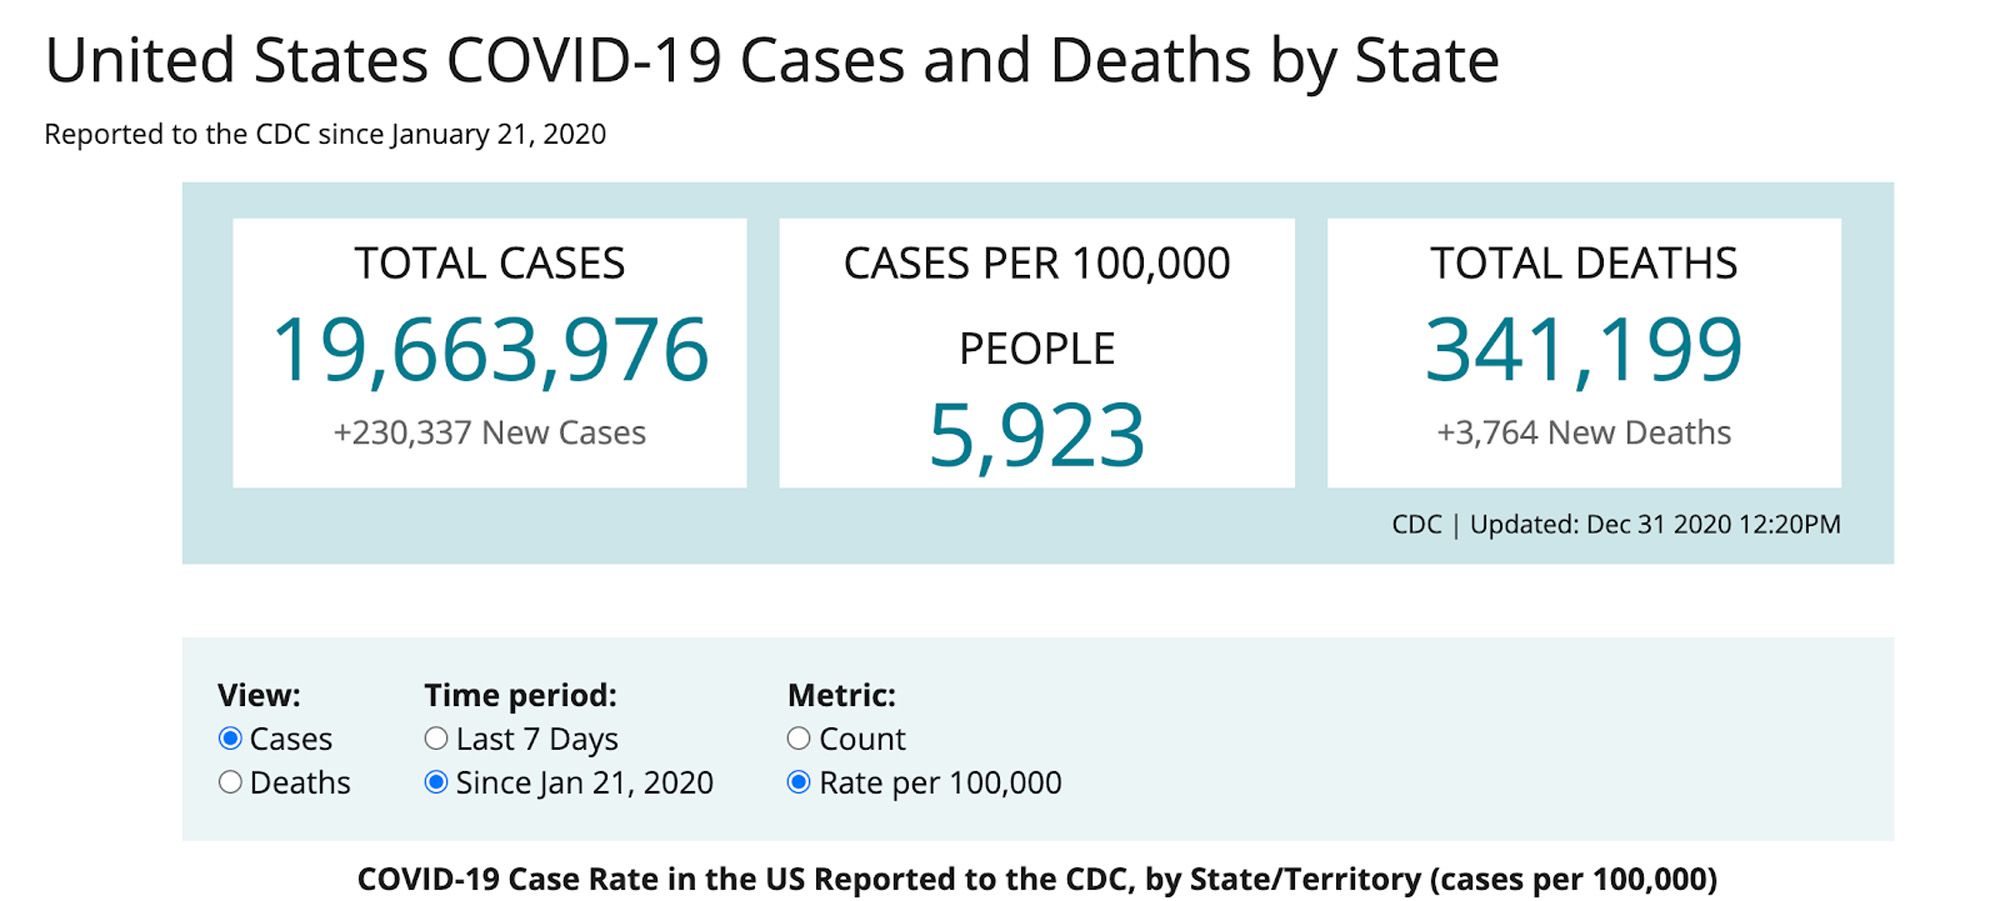 Still image of the Covid Dashboard from the Center for Disease Control
The challenge inherent with many of the visualizations is the reduction of illness and death to a corresponding plot point on a graph or statistic in a table. However, with the momentous task of tracking down the data and designing informative visual templates, some organizations have turned their attention to connecting the data to the human experience, so that new models of information design have emerged – advancing the method of data reporting from visualizing to storytelling.
As of this writing, 554,000 Americans are dead and 30 million have been infected with the coronavirus. We know these are big numbers, but there exist cognitive limitations in comprehending and processing numbers this large. Once the numbers exceed a known or relateable benchmark, the data loses its meaning and many organizations have responded by making the numbers relatable by providing their context. The Washington Post mapped the numbers to a caravan of 94.7 motor coaches nearly 100 miles long and claimed it would take an 87 foot tall Vietnam Veterans memorial to hold the nearly half million names. These comparisons are effective at making the scale of numbers relatable, but they don’t humanize the numbers.
Neurological studies have proven that we activate different parts of our brains when responding to numbers than parts of the brain activated when responding to stories. That fact presents an inherent challenge to information designers. Reducing human loss and tragedy to numbers is, by scientific definition, dehumanizing. As Stalin stated: “One man’s death is a tragedy, the death of millions is a statistic.” The statistics are important, but how can designers make emotional connections between the data and the tragedy that data represents?
A project originating out of Brazil as the result of a partnership between Agência Lupa, the Google News Initiative and adopted by the Washington Post, is an effective demonstration of one attempt to make the Covid statistics relatable and more meaningful. This initiative uses geographic datasets to simultaneously provide context for the scale of the numbers and a reference to the human toll. The reader’s neighborhood is used as the benchmark for displaying the death toll – relating the tally to a known reference – the number of people who live near you. The approach serves to effectively provide a frame of reference for the numeric scale, but it also serves as a powerful reminder that the virus lives among us and is likely impacting our neighbors.
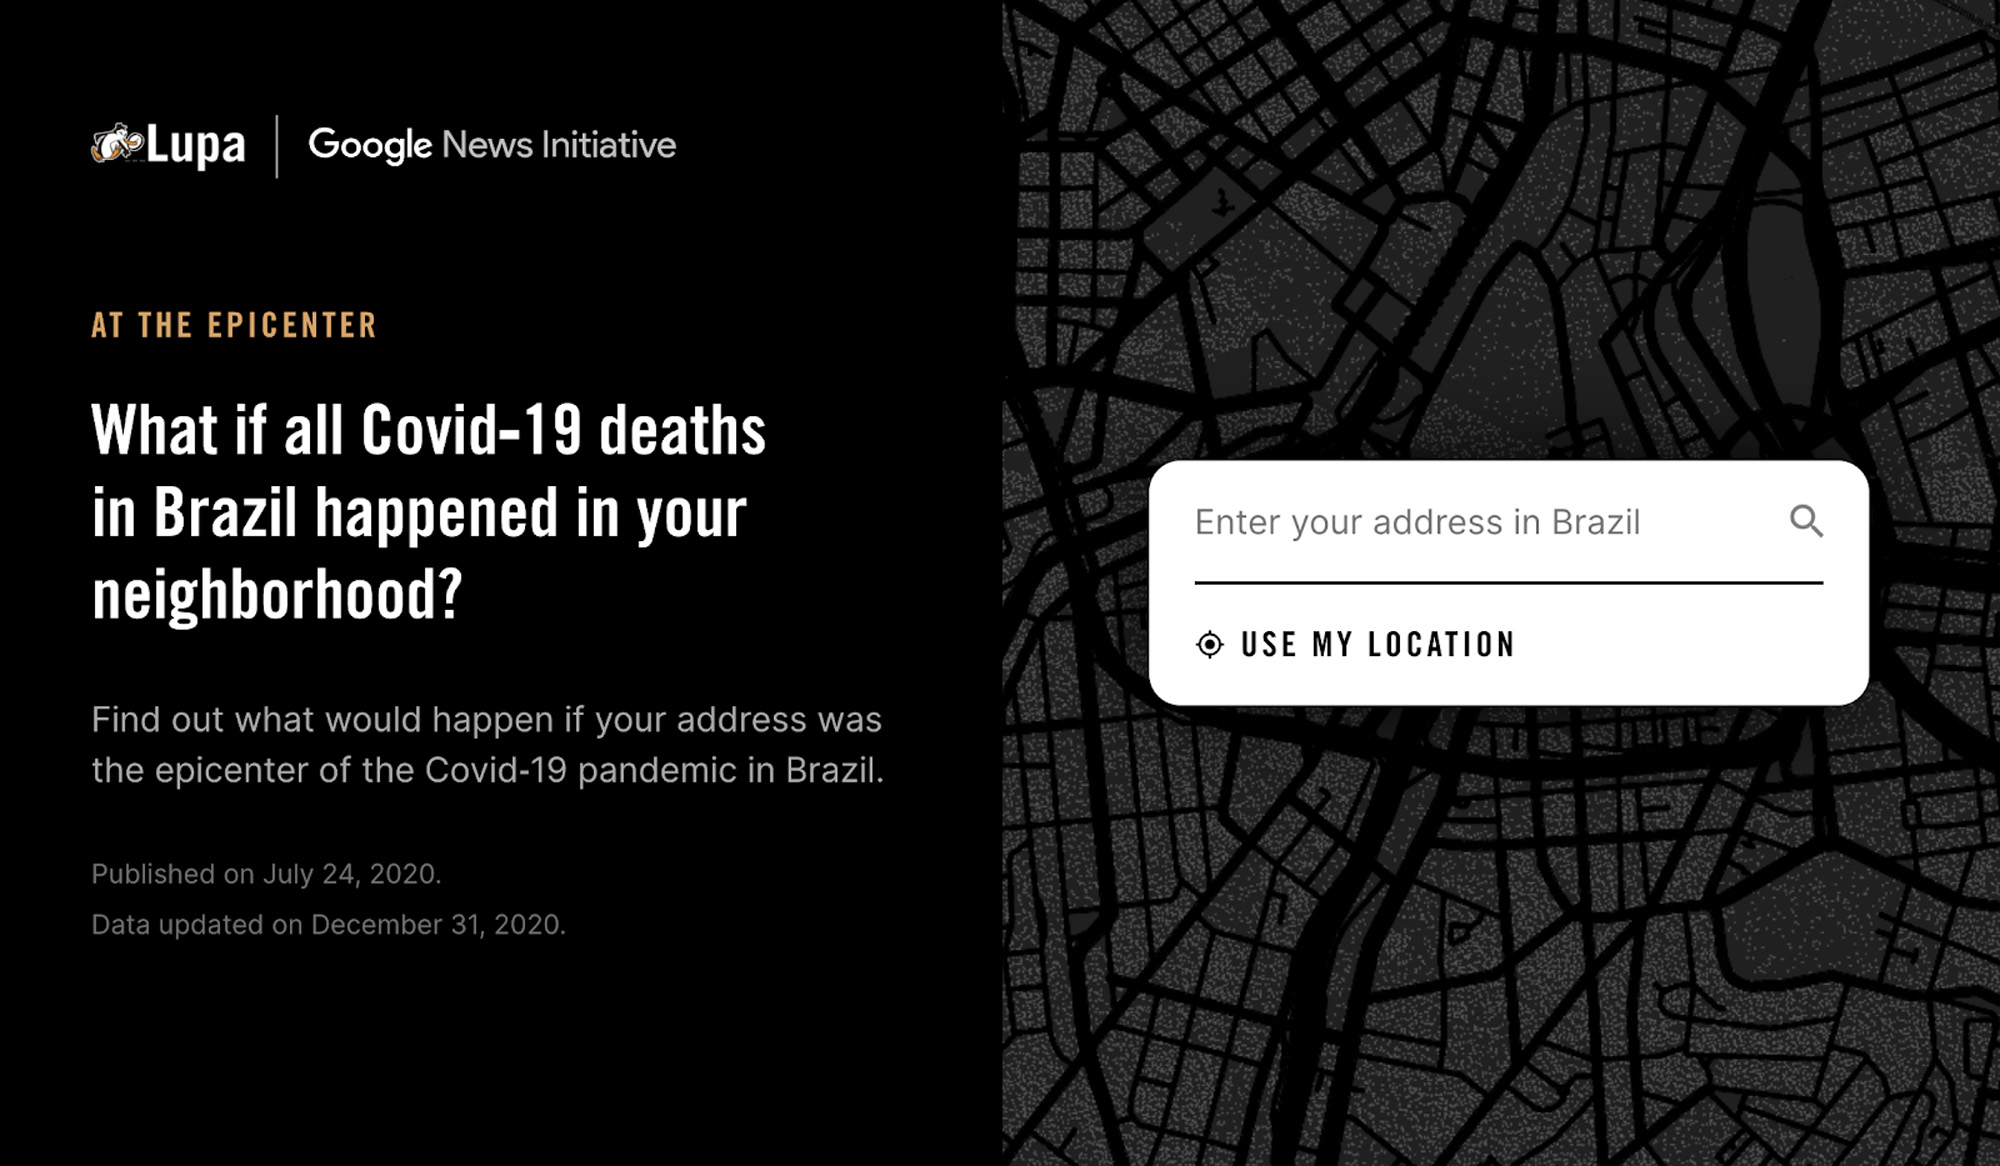 Starting point for the interactive project from Agência Lupa and the Google News Initiative
Other approaches for humanizing data include extending the traditional toolkit of a data visualization beyond the familiar visual formats of charts and graphs. The New York Times’ audio comparison of noise on a busy street corner of Lafayette and East Fourth Streets in New York City on an April day in 2019 versus the same date in April 2020, is a good example of using audio as a data tool and its potential. The year-on-year comparison, provides evidence of the reduction of familiar city noises and the dearth of the hustle and bustle of people going about their daily lives. This simple data visualization (or is it audio-ization?) is a powerful and relatable contrast, appealing to the experiential processing center of the brain, rather than the more analytical part of the brain. Our brains are programmed to react to audio with an emotional response. We can easily relate to the sounds, accept their authenticity, and picture ourselves in the scene. The volume and quality of the noise around us has been dramatically altered during Covid, whether more noise at home or less noise in the streets, and audio is a mostly overlooked but proven accurate technique for expressing covid’s impact in a meaningful way.
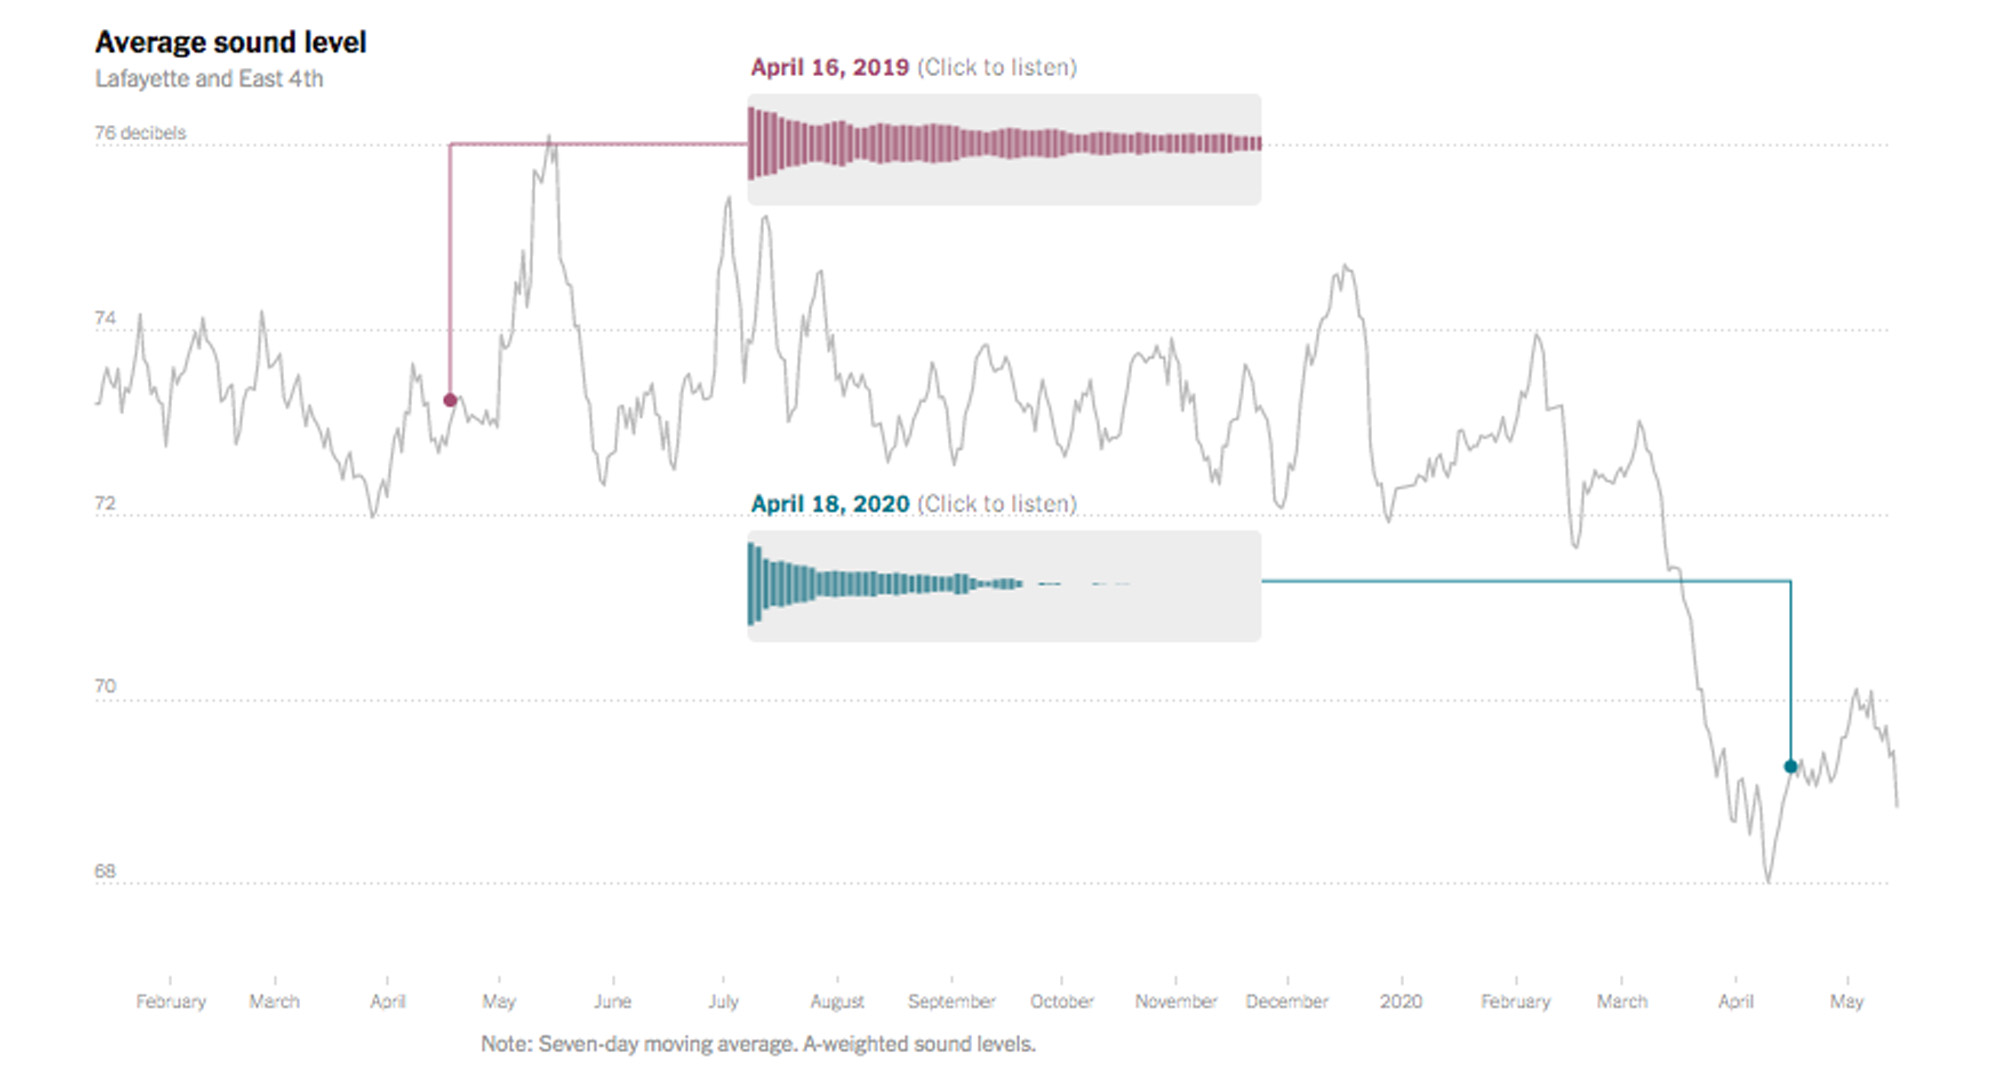 Graph of audio levels since the start of the pandemic, taken from The New York Times article, “The Coronavirus Quieted City Noise. Listen to What’s Left”
Photography, particularly human portraits, is another technique for bringing humanity to data. The fact that images have an impact on our emotions, especially when that image represents an individual and a narrative, is well documented. “Think of Henri Cartier-Bresson’s “Behind the Gare Saint-Lazare”, Nick Ut’s “Napalm Girl” or Richard Avedon’s portrait of Marilyn Monroe. These iconic images capture intent, desire, suffering, pain, ambivalence, and invoke our ability to identify with those in the frame.”1
The Washington Post’s visual list of the deceased from Covid, is a striking example of how photography brings a sobering reality to those deaths and their staggering number. The Post used machine learning to create photo-realistic images of the deceased, giving a reader the ability to ascertain the scale of death by looking at the human toll. Each photograph can offer a unique human connection. The image array is presented on a single page that a reader can scroll, which enables the reader to both notice and feel the scale of Covid’s toll by literally engaging with it through the act of scrolling. The result is a devastating reminder that every statistic represents a human life.
Human psychology studies2 indicate that faces are the most evocative images used to represent a human life. Our attention is naturally drawn to human faces, especially those that appear to be making eye contact with us. Our brains interpret eye contact as an invitation to engage and the designer’s choice to make the photos appear as though they are looking directly at the reader adds to the emotional impact of the photograph. Human beings are wired to react to people looking at us. In fact, one of the first, natural instincts of healthy babies is their ability to make eye contact.
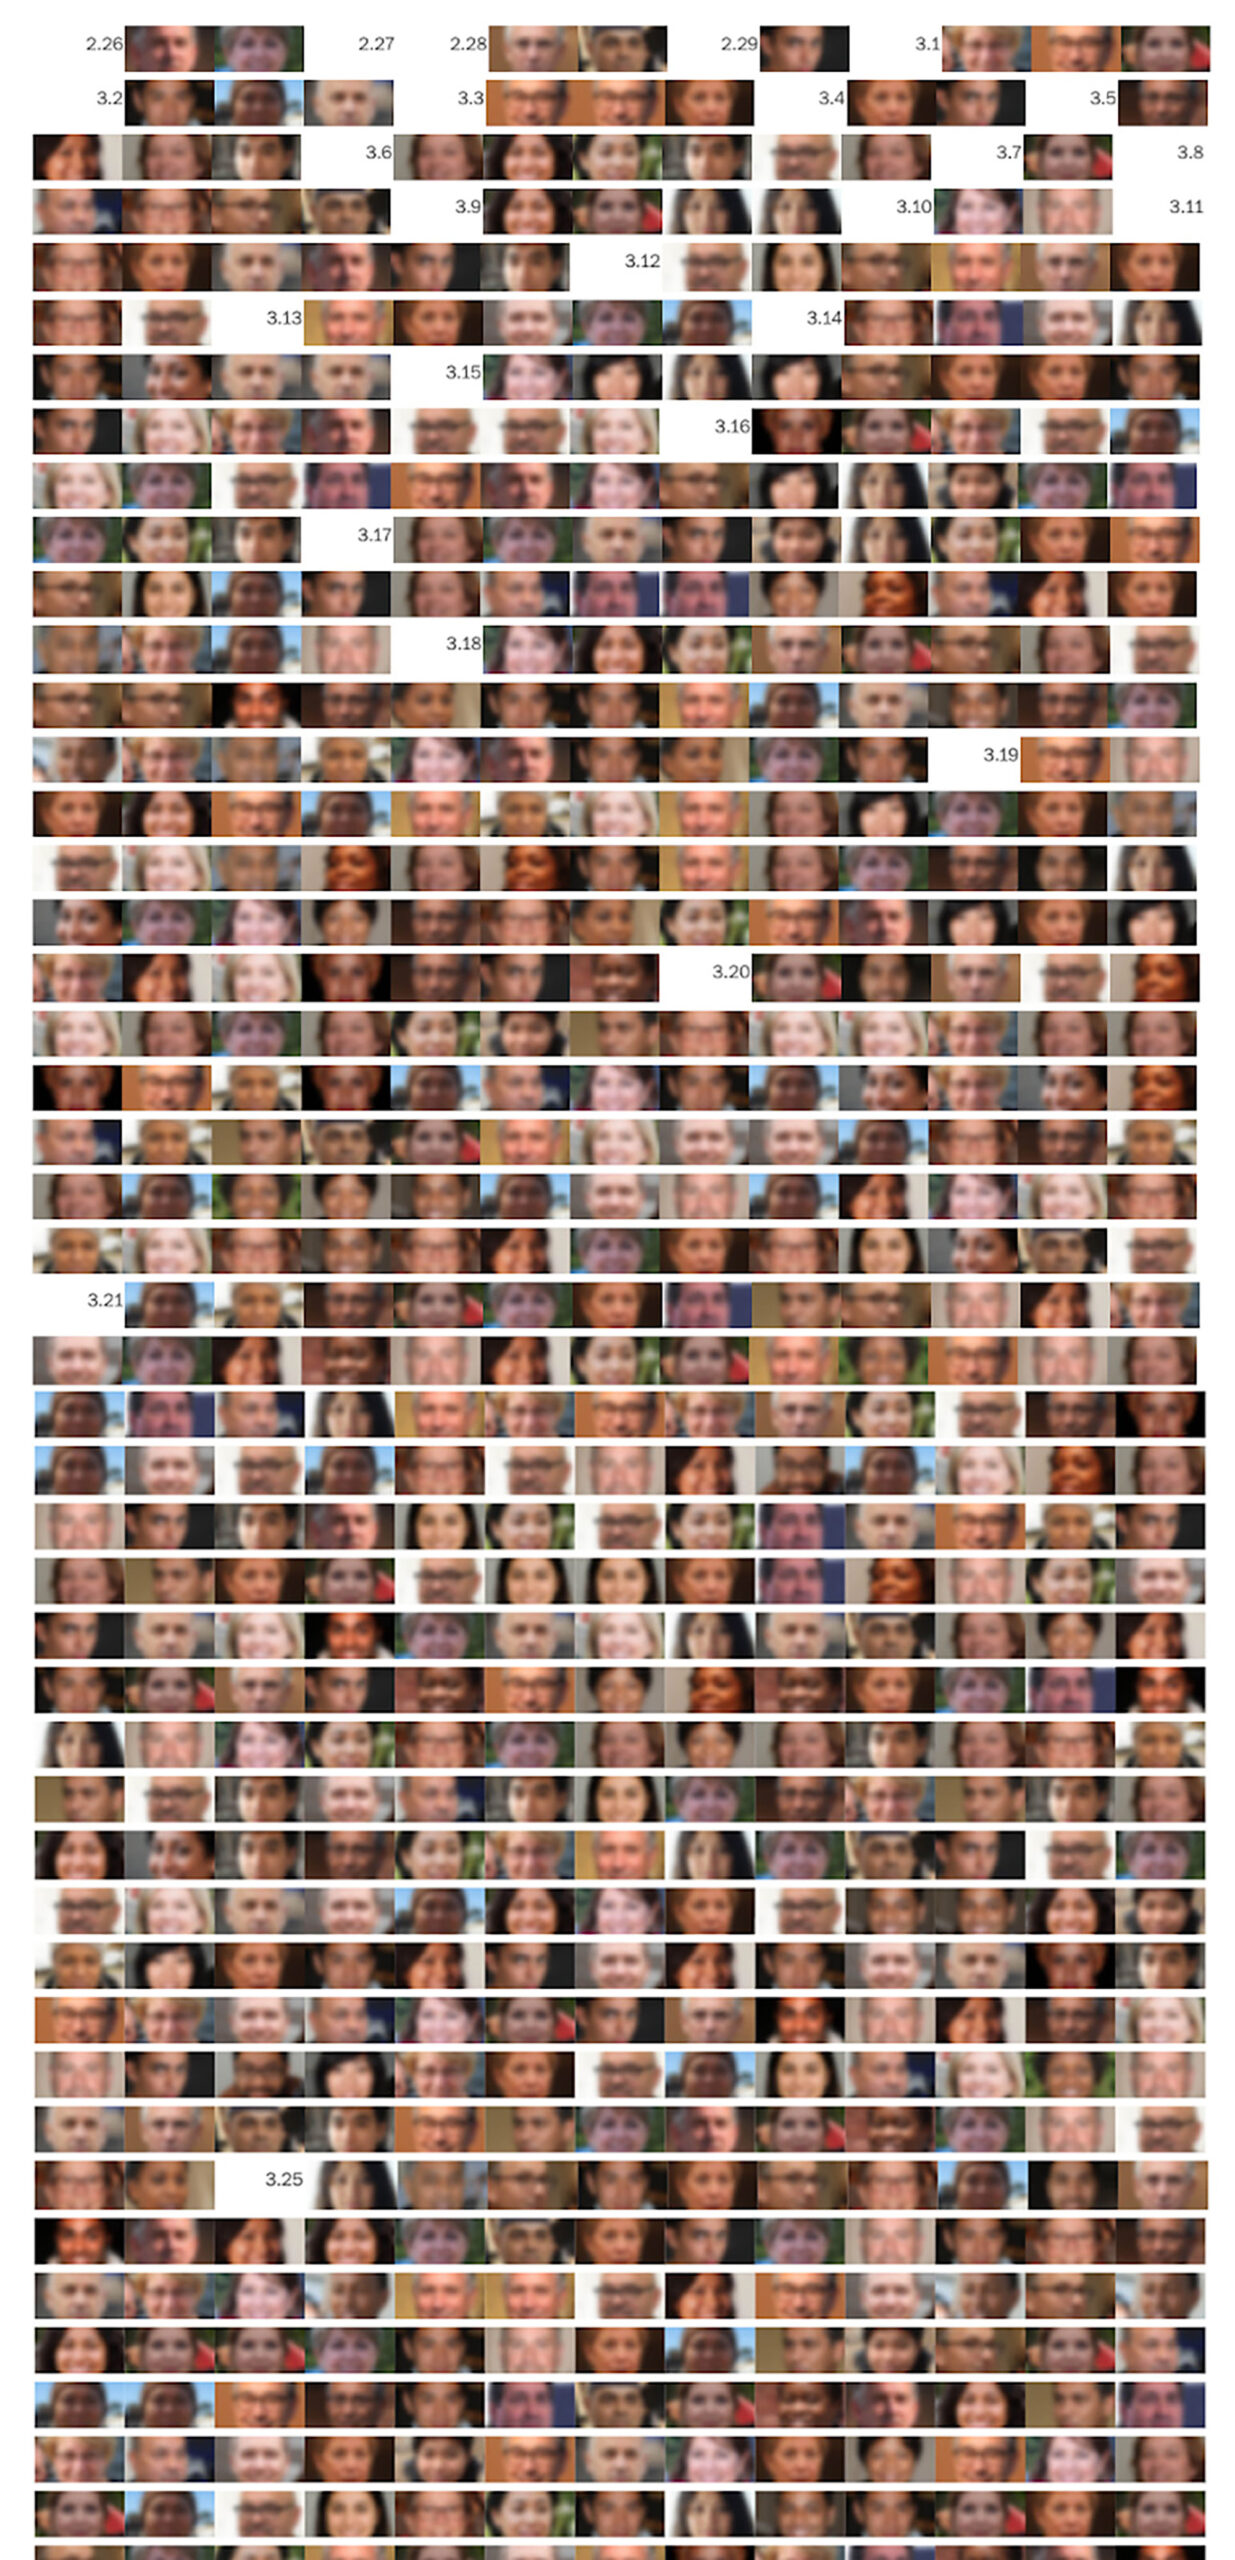 Still image from The Washington Post’s interactive graphic, displaying blurred versions of machine-generated faces, representing the Americans lost to Covid-19 (based on demographics)
Animation is another useful tool to help clarify and humanize data. The New York Times, How the Virus Got Out essay offers an analysis of the movements of hundreds of millions of people in the early days of the pandemic. Animated dots represent individuals and their travel patterns, capturing the motion and energy associated with travel and make a convincing case for the spread of the virus through human movement. This progressive revealing of information across a series of maps allows a reader to literally see the virus spread as the dots disperse. The animation starts with small, relatable numbers – from four cases to dozens to thousands to tens of thousands – providing a benchmark of scale before overwhelming a reader with overwhelming numbers.
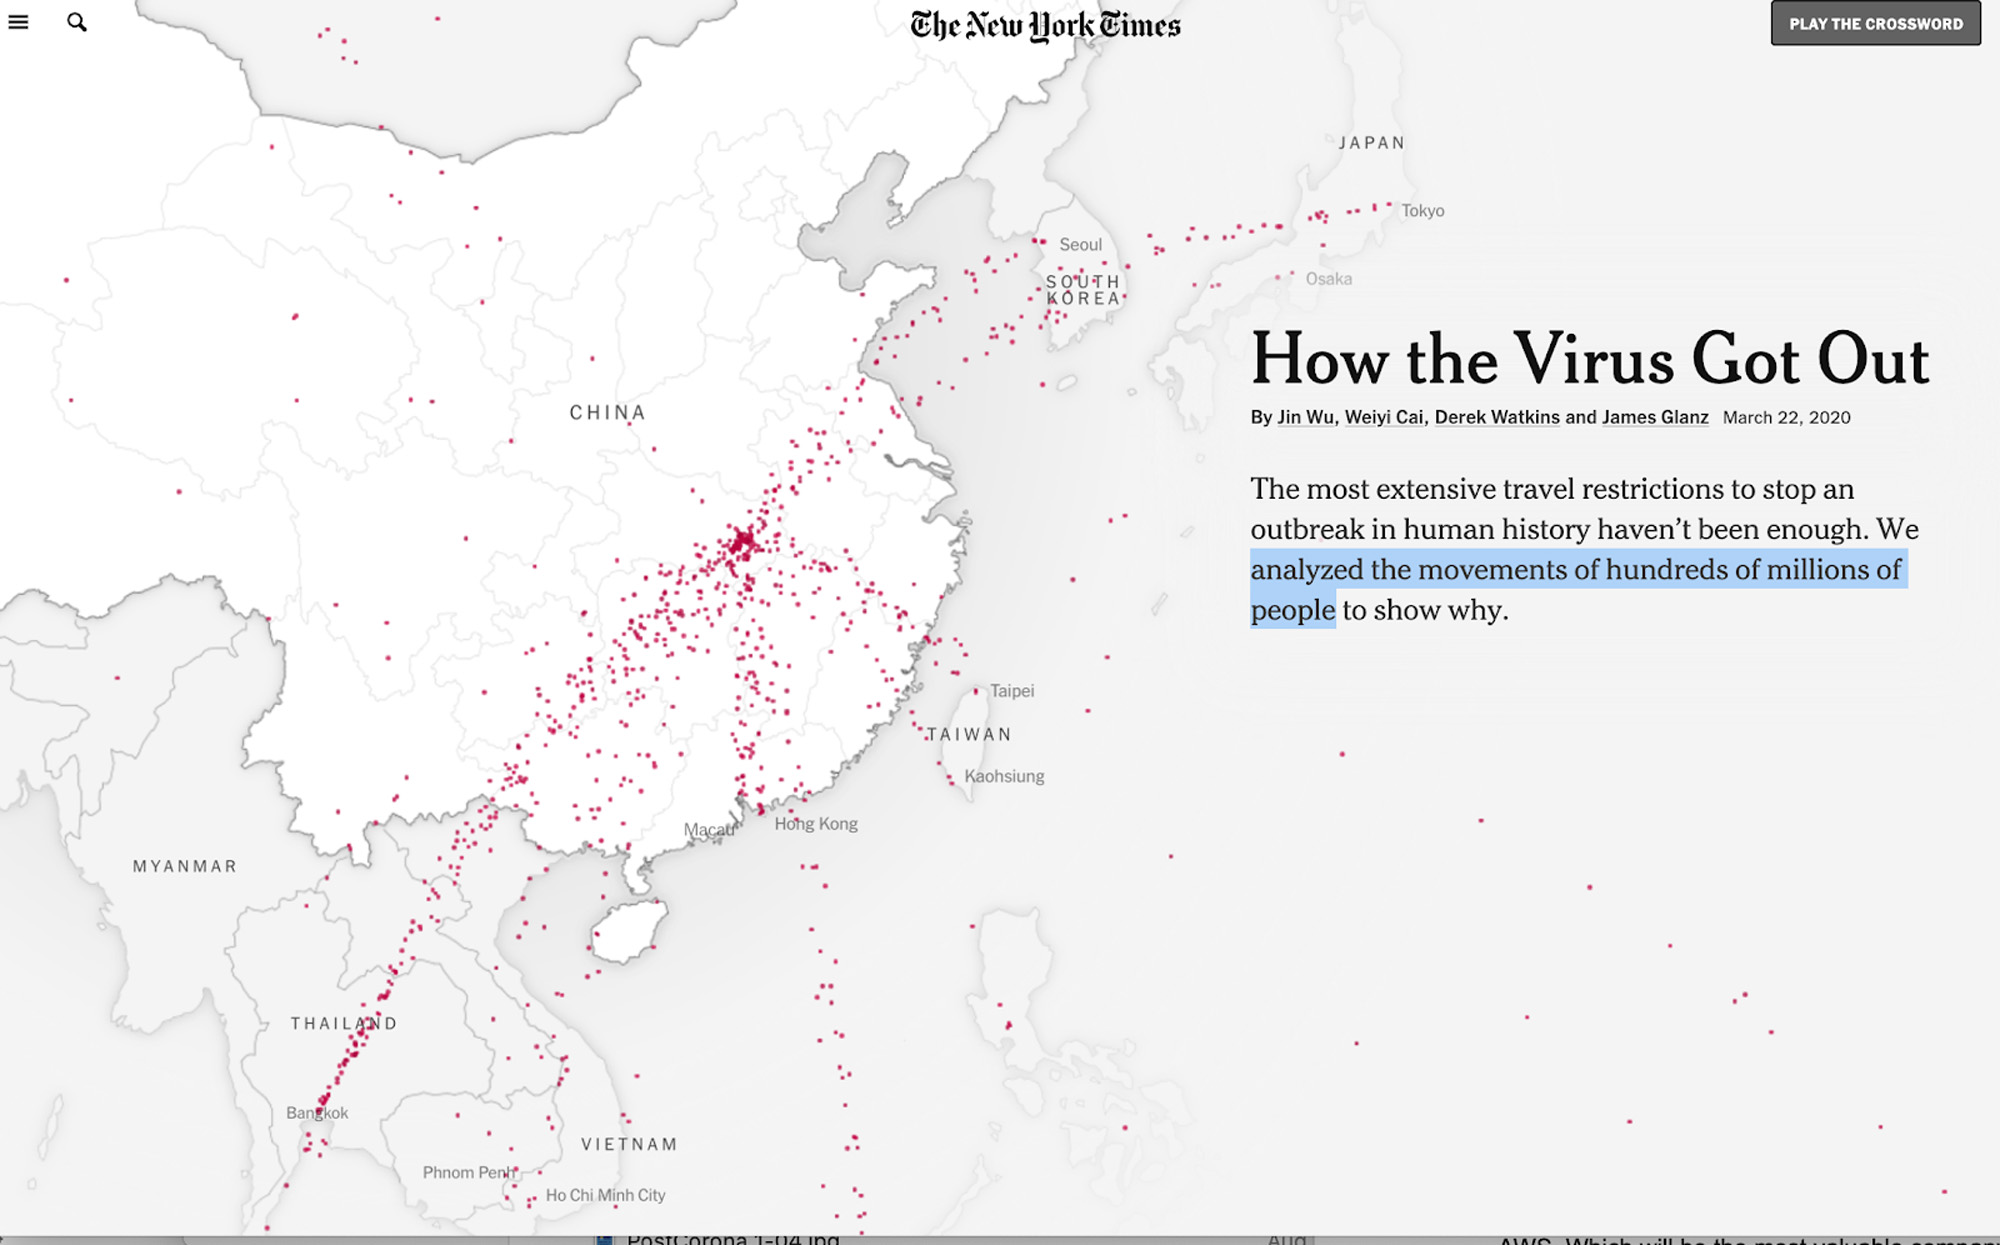
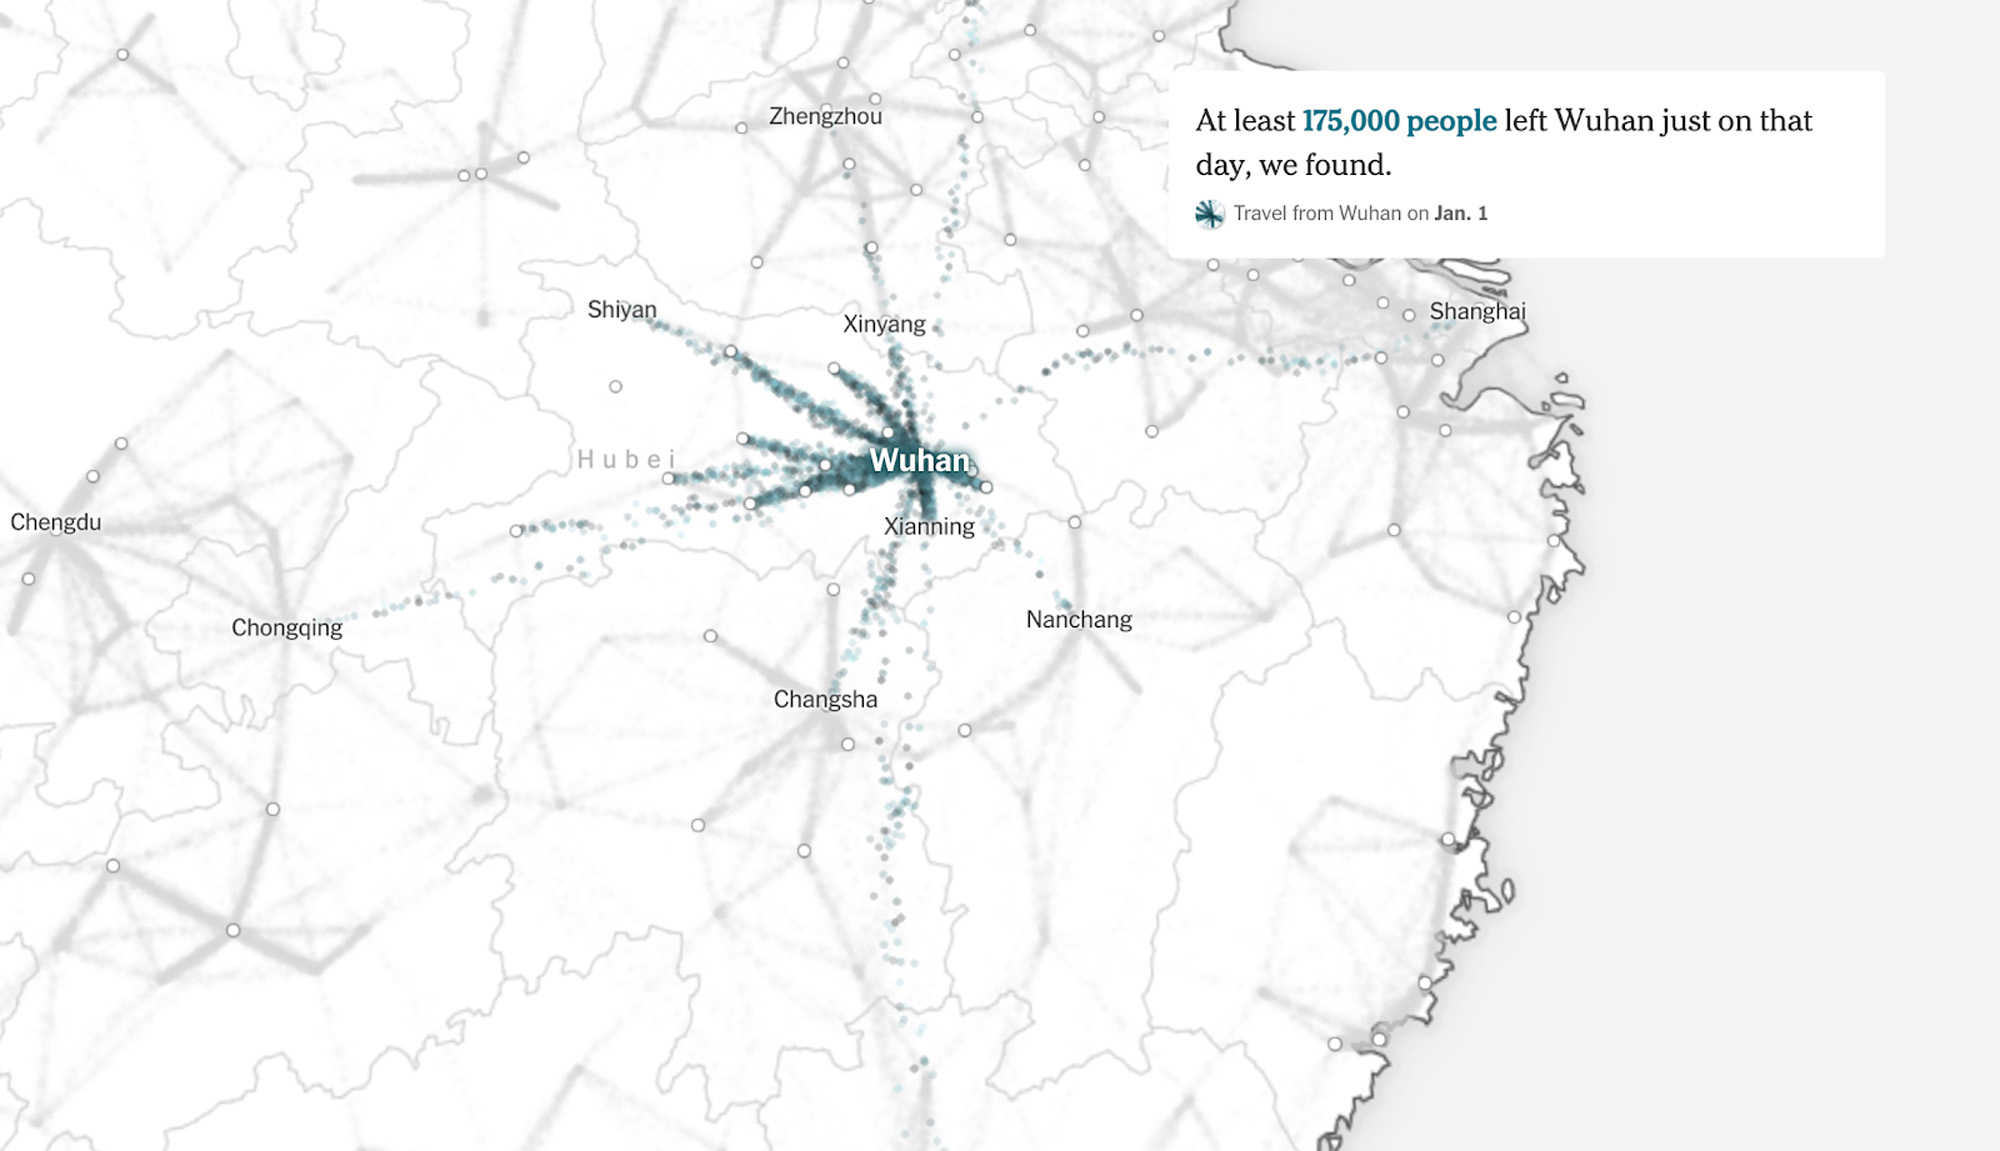 Still images of the interactive graphic from The New York Times article, “How the Virus Got Out”
The examples above are a few of the ways information designers are innovating to make the connection between the numbers of this pandemic and the story of human tragedy behind them. Many of the capabilities applied in these examples, such as the use of multimedia and enhanced display capabilities, are only recently possible due to the advances in machine learning, enhanced processing power and improved network speeds. What other possibilities do these enhancements offer in bridging the gap between ‘data visualization’ and ‘data storytelling’? What are the implications for data in an era where we can create realistic 3-D environments and virtual worlds? What does it mean to be a data journalist in an era when network speeds offer almost limitless visualization capabilities?
Our challenge and our opportunity as designers is to use our skills and the recently possible capabilities to tell a more complete story – a story that extracts meaning from a massive information flow. Regardless of the tools, the onus remains to ask the right questions of the data sets and remind our audience that the numbers aren’t the real story of the tragedy they represent. The real story is the human toll.
Footnotes
- Sarinana, Joshua. “Photography and the Feelings of Others: From Mirroring Emotions to the Theory of Mind.” PetaPixel, 26 Oct. 2014, petapixel.com/2014/10/25/photography-feelings-others-mirroring-emotions-theory-mind.
- Slovic, Paul. “‘If I Look at the Mass I Will Never Act’: Psychic Numbing and Genocide.” Judgment and Decision Making, vol. 2, no. 2, 2007, pp. 79–95, psycnet.apa.org/record/2007-06350-001.
Katherine holds a Bachelor’s in Architecture degree from Cornell University and a Master’s of Architecture degree from the Harvard University Graduate School of Design, where she was awarded the Sheldon Fellowship for post-graduate research at Cambridge University. She has been teaching at ITP since 2010 and has developed and taught : Visual Language (ITP), Design Fundamentals (IMA), UX Design (IMA), Designing Meaningful Interactions (ITP), Design for Change (ITP), and 100 Days of Making (ITP). Katherine also served on the ITP thesis faculty at ITP from 2013-2017.
Her professional career is defined by a focus on visual storytelling as applied through graphic design, data visualization, information design and user experience design. Katherine has been a partner and creative lead in three successful startup businesses: UncommonGoods, an e-commerce business, Dillon | Thompson, a digital media agency, and L2 Inc., a business intelligence firm acquired by Gartner Inc. in 2017. She started her professional career at ABC Television, where she served as ABC News’ Creative Director of Broadcast Graphics and as the founding General Manager of ABCNEWS.com. Dillon was awarded two Emmy awards for her creative work at ABC Television.