You may have wondered about the graphic band under each article in this issue. Is it tribal? Just a pretty graphic? No. It’s the article’s fingerprint, an abstracted abstract.
In the spirit of adjacency, we resisted a single theme, opting instead to show a range of topics and styles representing the diversity of emerging media. Yet among difference we wanted cohesion, without being too direct or obvious—let’s call it a slant resonance—that would encourage conversation across articles. I wanted to explore the qualities of similarity and dissimilarity from another point of view: text analysis. And I wanted to propose an interactive way of “reading” the journal graphically.
What can be read and seen in the articles themselves, but also beyond? I was determined to observe each article individually, and then study them as a group to see what possible relationships might exist among them by analyzing the texts at the level of the concepts discussed and through their words and overarching themes..
In-dividual
I developed a system for generating a unique visual identifier—a fingerprint, or ‘articleprint’—for each of the texts. This procedure was created with one important consideration in mind: it should work with any article written in English, regardless of its content and length. The set of images would contain some part of the “essence” of each text, compressing it, but I did not want the ‘articleprint’ images to be too explicit—e.g., a map or graph.
During the creation process, thanks to Ben Blatt1 I stumbled upon Inference and Disputed Authorship: The Federalist by Frederick Mosteller and David L. Wallace, published in 1964. In this book, the authors describe a statistical analysis they performed to determine the authorship of the disputed essays within The Federalist Papers: twelve essays of unknown origin within a book of 85 essays by Alexander Hamilton, James Madison, and John Jay. Mosteller and Wallace developed a procedure to measure the frequency of use of seventy common words2 in various texts by Hamilton and Madison, and they compared these frequencies with those from the disputed texts. They found that they could obtain a unique numerical signature for each essay, that this signature was similar among texts written by the same author, and that it was very different between texts of different authors. With these assumptions, they could assert that the author was Madison.
Inspired by Mosteller and Wallace, I measured the frequency of use of the same seventy words in each of the articles in the journal to get their numerical signature, and then developed a convoluted and interlaced bar chart system that visualized the results. After a long process of experimentation, I arrived at a graphic system that was appropriate for this issue of the journal. The resulting visual accompanies each text from which it emerged. All of them can be seen together below, along with the title of their corresponding article.
In-relation
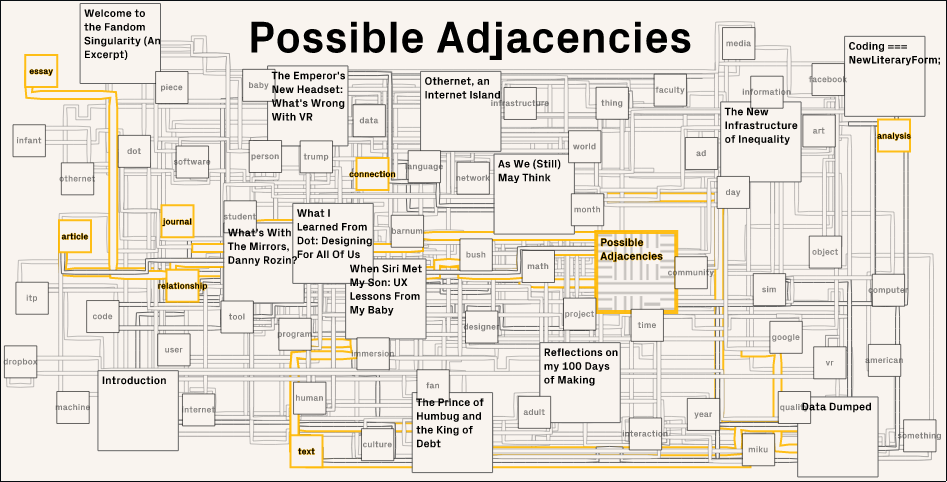
Could analyzing the journal as a whole uncover the relationships across the articles? From a computational point of view, could we find these connections and map them? Can algorithms help us analyze products of human creativity, and what, if anything, is missing from the results? Looking at these ‘articleprints’ for example, doesn’t indicate anything about the articles’ content. In contrast to the individual fingerprints, I wanted to create an additional interactive map that offers an alternative navigation scheme to the predefined table of contents.
Here I used a text analysis technique called tf-idf: Term Frequency-Inverse Document Frequency. This process susses out the most important terms (defined as most frequently used) in one article in relation to another. I applied this technique to every article, comparing each of them with the rest of the issue, to get the list of most important nouns in each piece. I also compared two texts at a time by searching for the nouns on both articles’ lists I referred to these terms as the “links” between articles. Sometimes there were many, sometimes there were none.
Using all the links, I constructed the map above of boxes and pipes, or circuits and cables. The articles are connected to their links, and the links are connected to their articles. The connections are interactive, so readers can explore. The position of the articles loosely depends on how close or far they are in terms of links. Finally, in addition to a fragment of their ‘articleprint,’ each article contains and displays some human-collected bits of important content, possibly filling in the gaps left by the computational analysis.


")


 May Think")


While this first graphic experiment produced unique fingerprints and mapped links between articles—making their adjacencies explicit —future issues will continue exploring alternative ways of reading the texts. Computation can provide interpretation, yet the procedure for developing these algorithms and frameworks is still fundamentally informed by a human reading a body of text. Through these visual experiments, ADJACENT is dedicated to revealing and inspiring the latent connections across ideas.