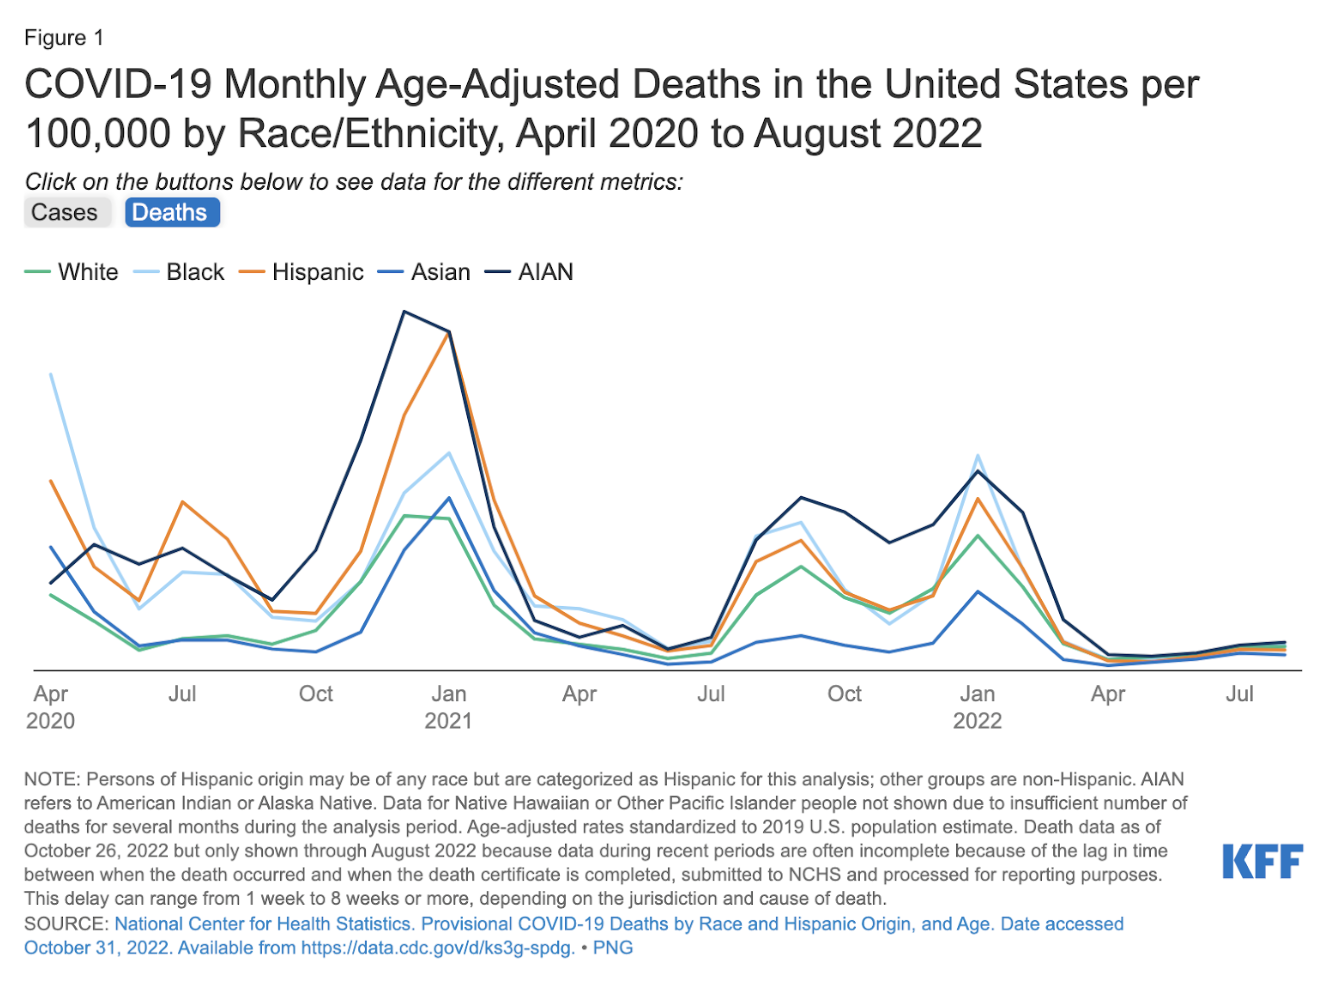
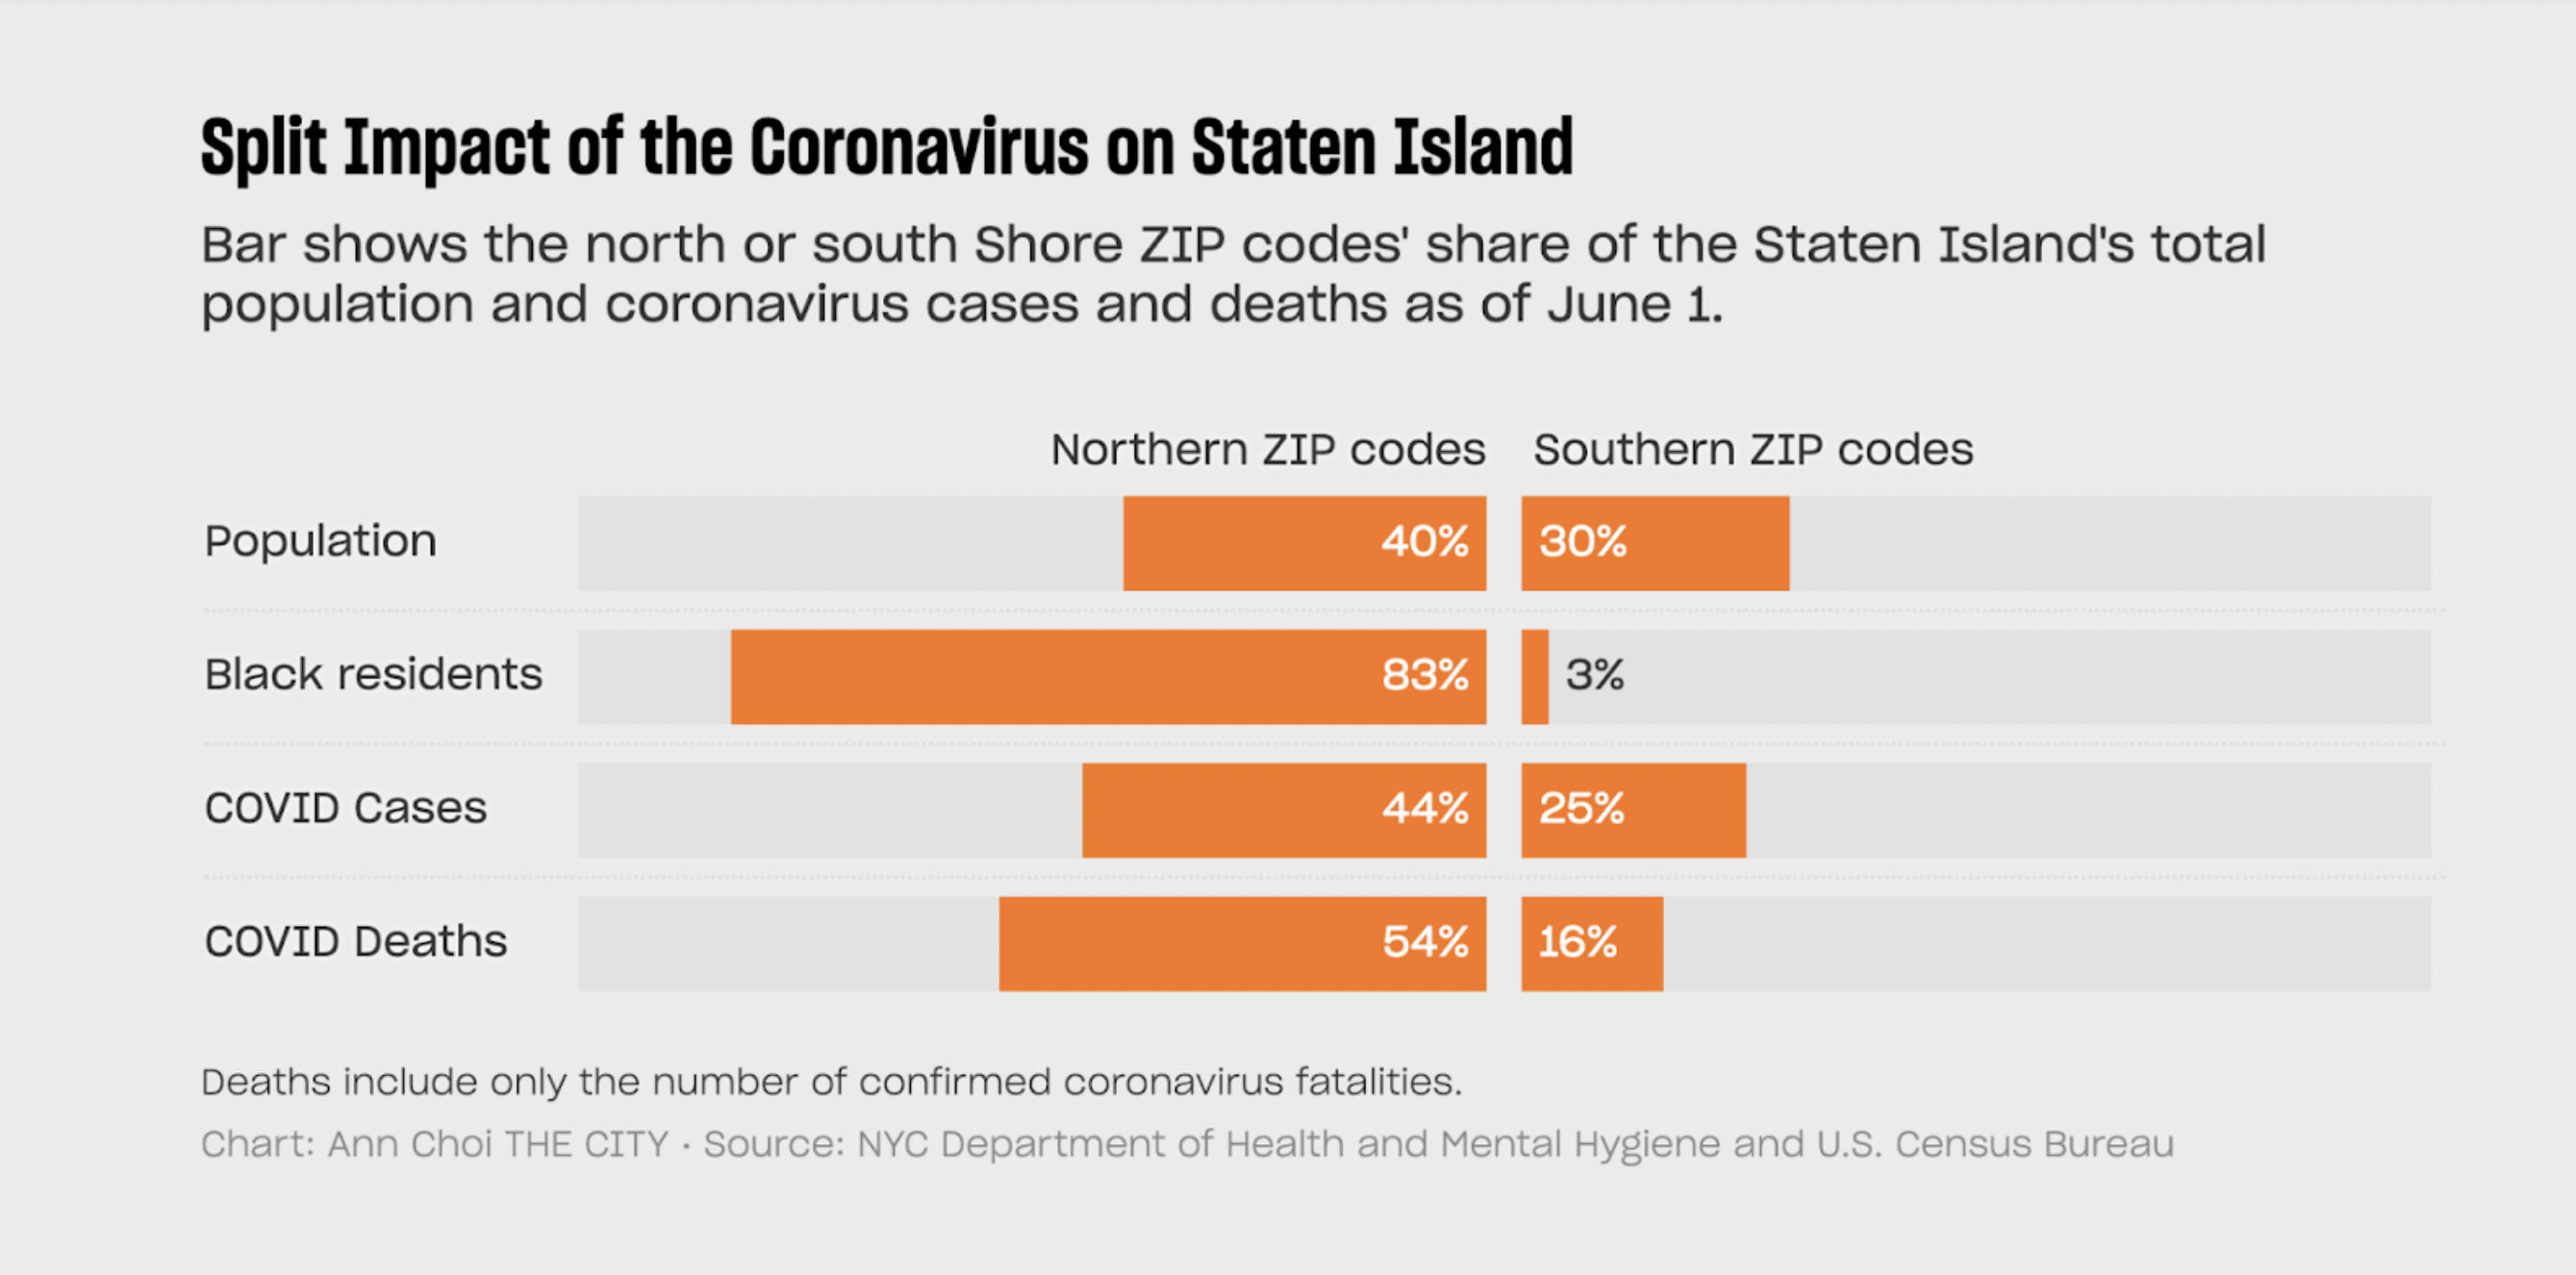
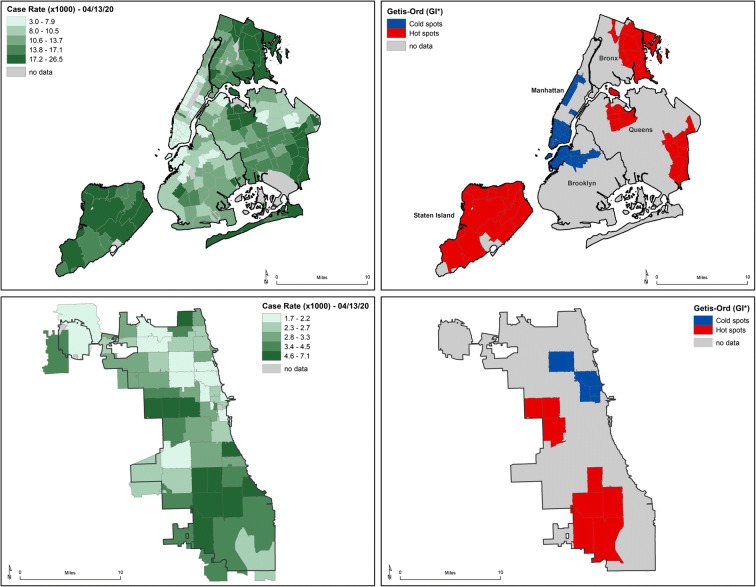
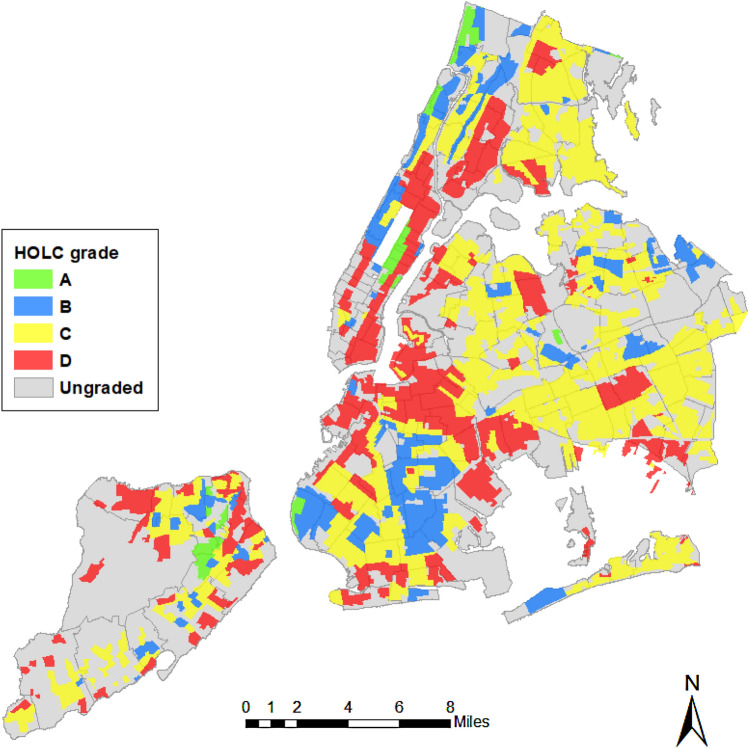
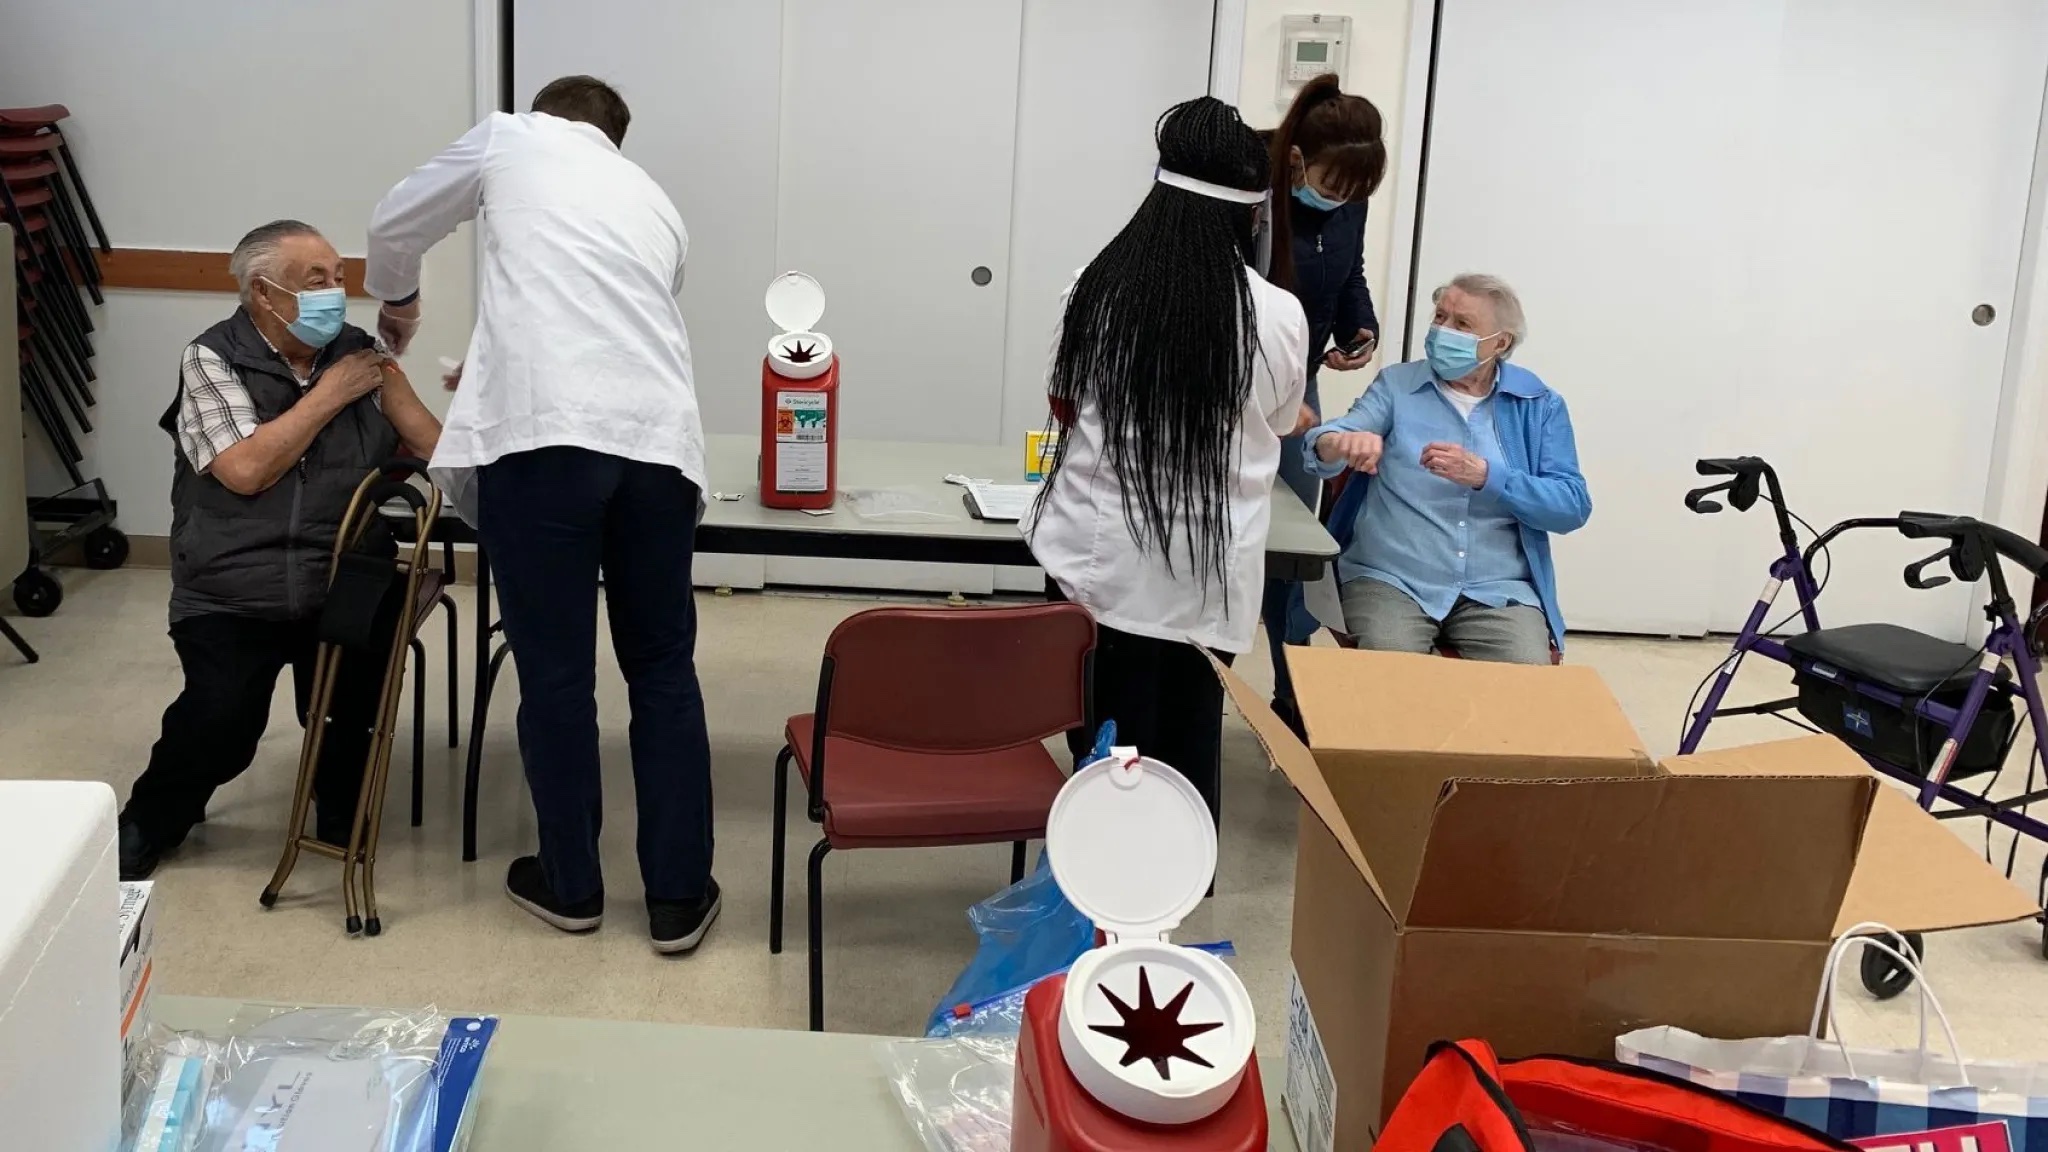
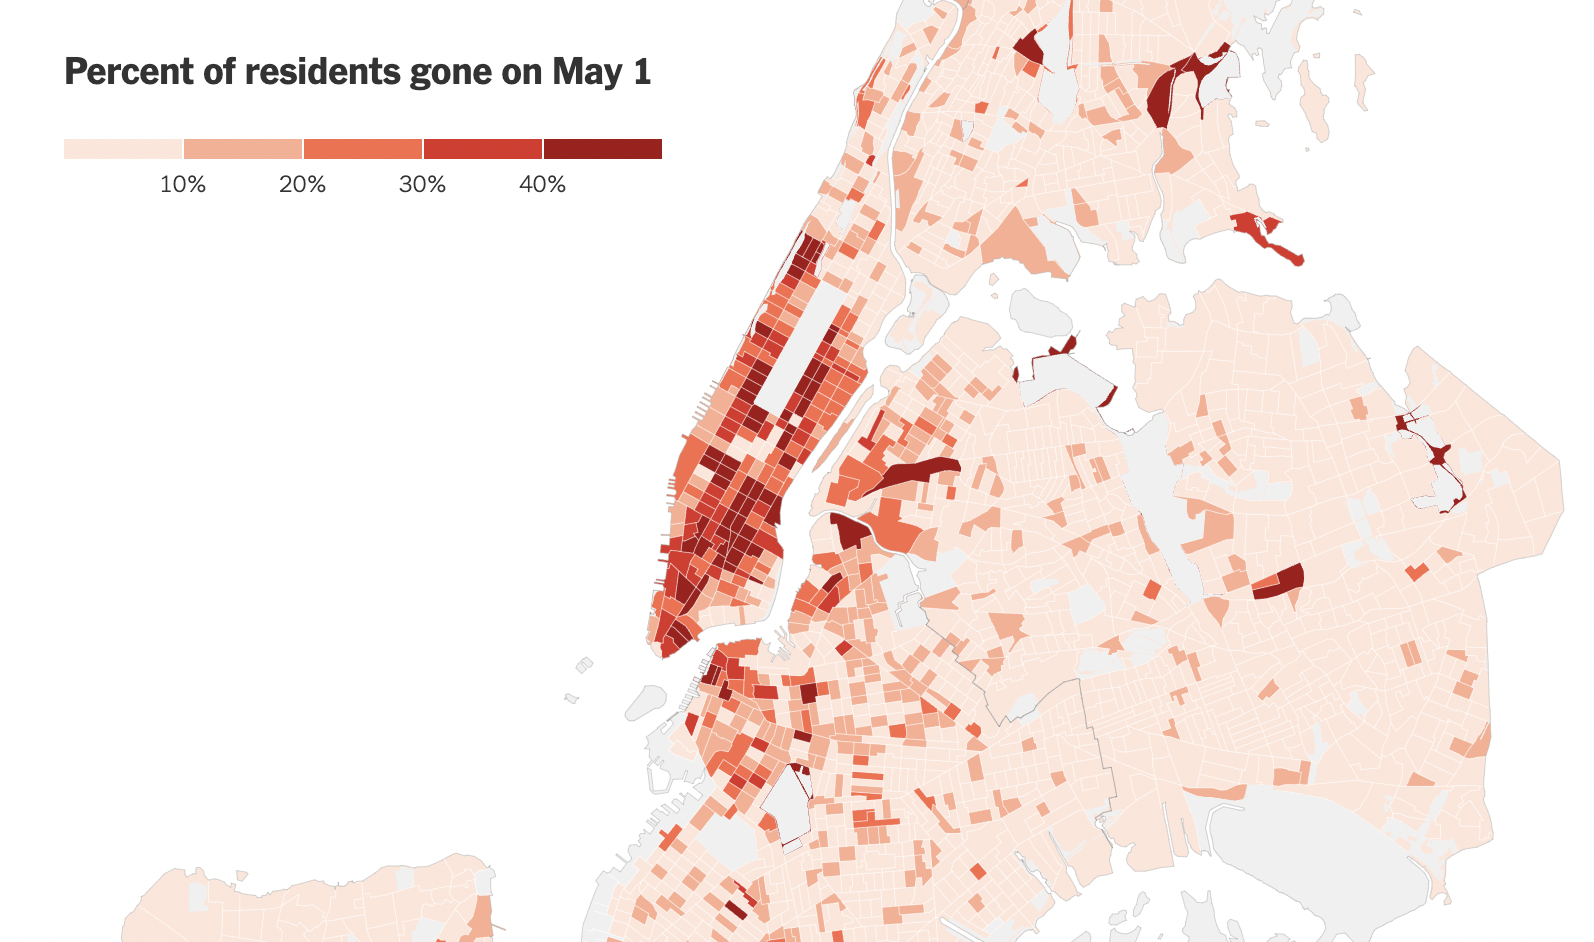
Structural racism, structural inequalities and historical discrimination enforced through law and custom from the federal to the state and neighborhood level are at the root of the disproportionate impact of COVID-19 on racial and ethnic minorities.
Browse this article by Kaiser Family Foundation to learn more.
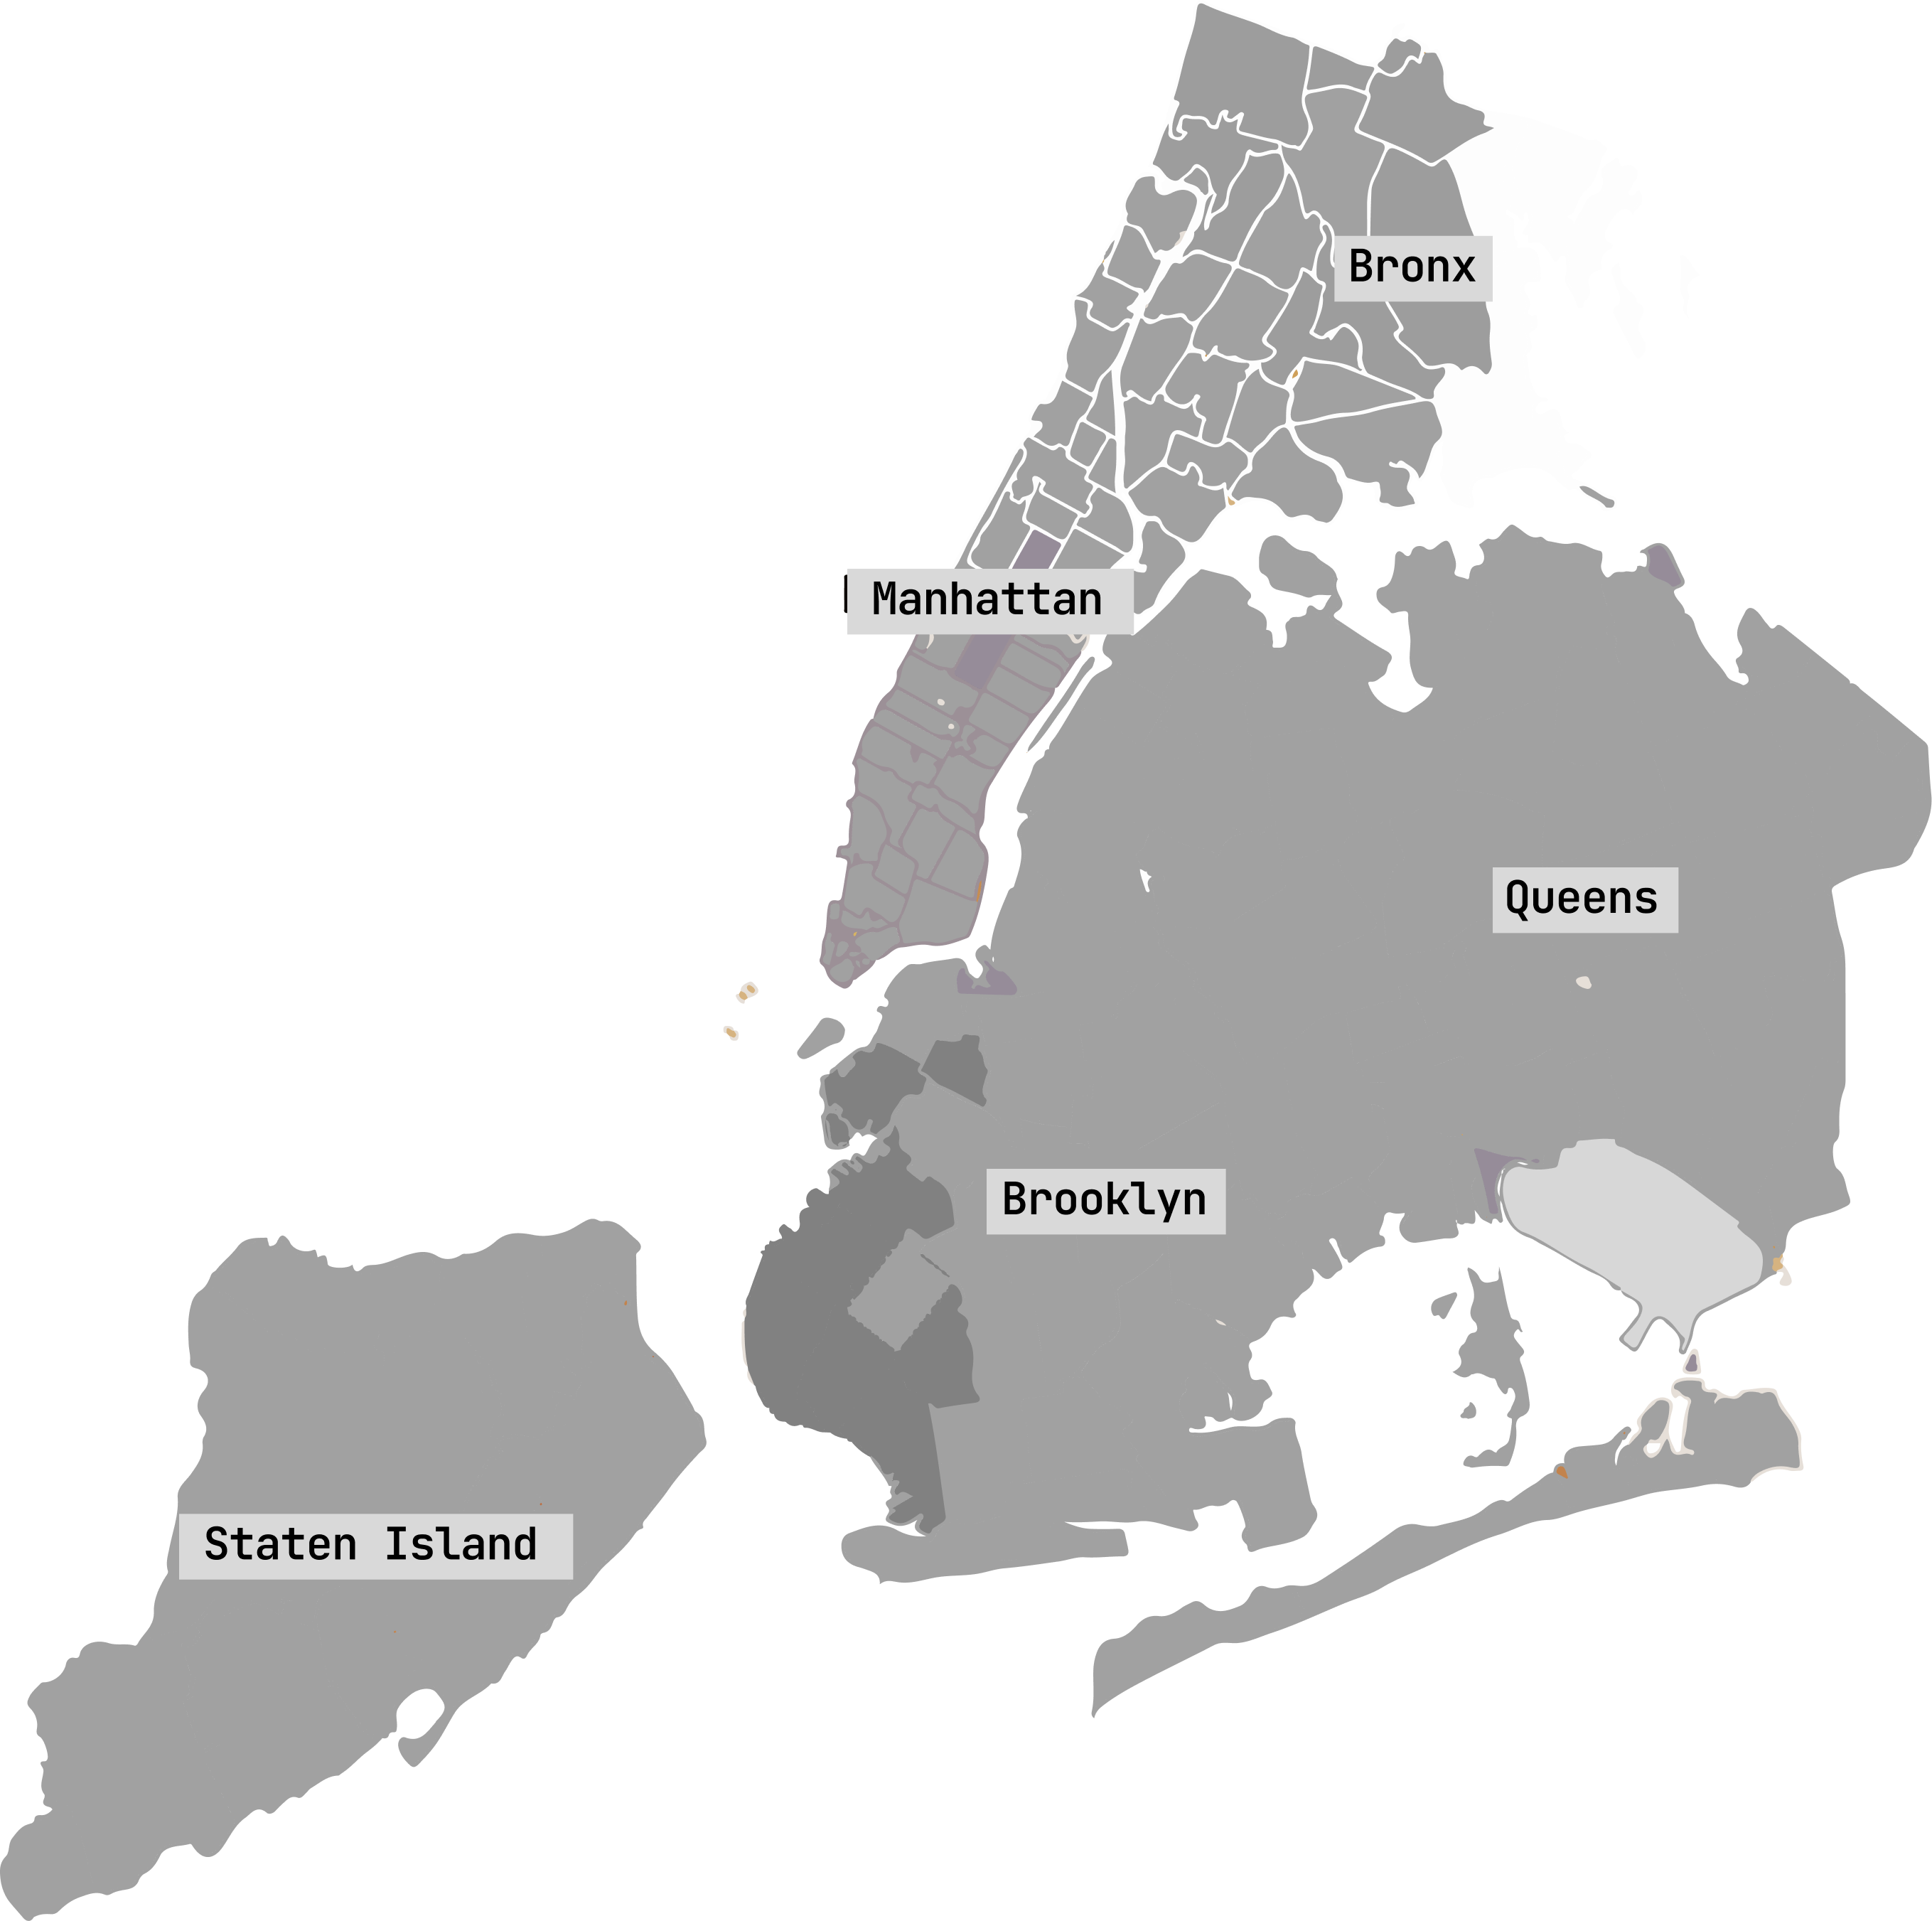
Select To Explore The Map
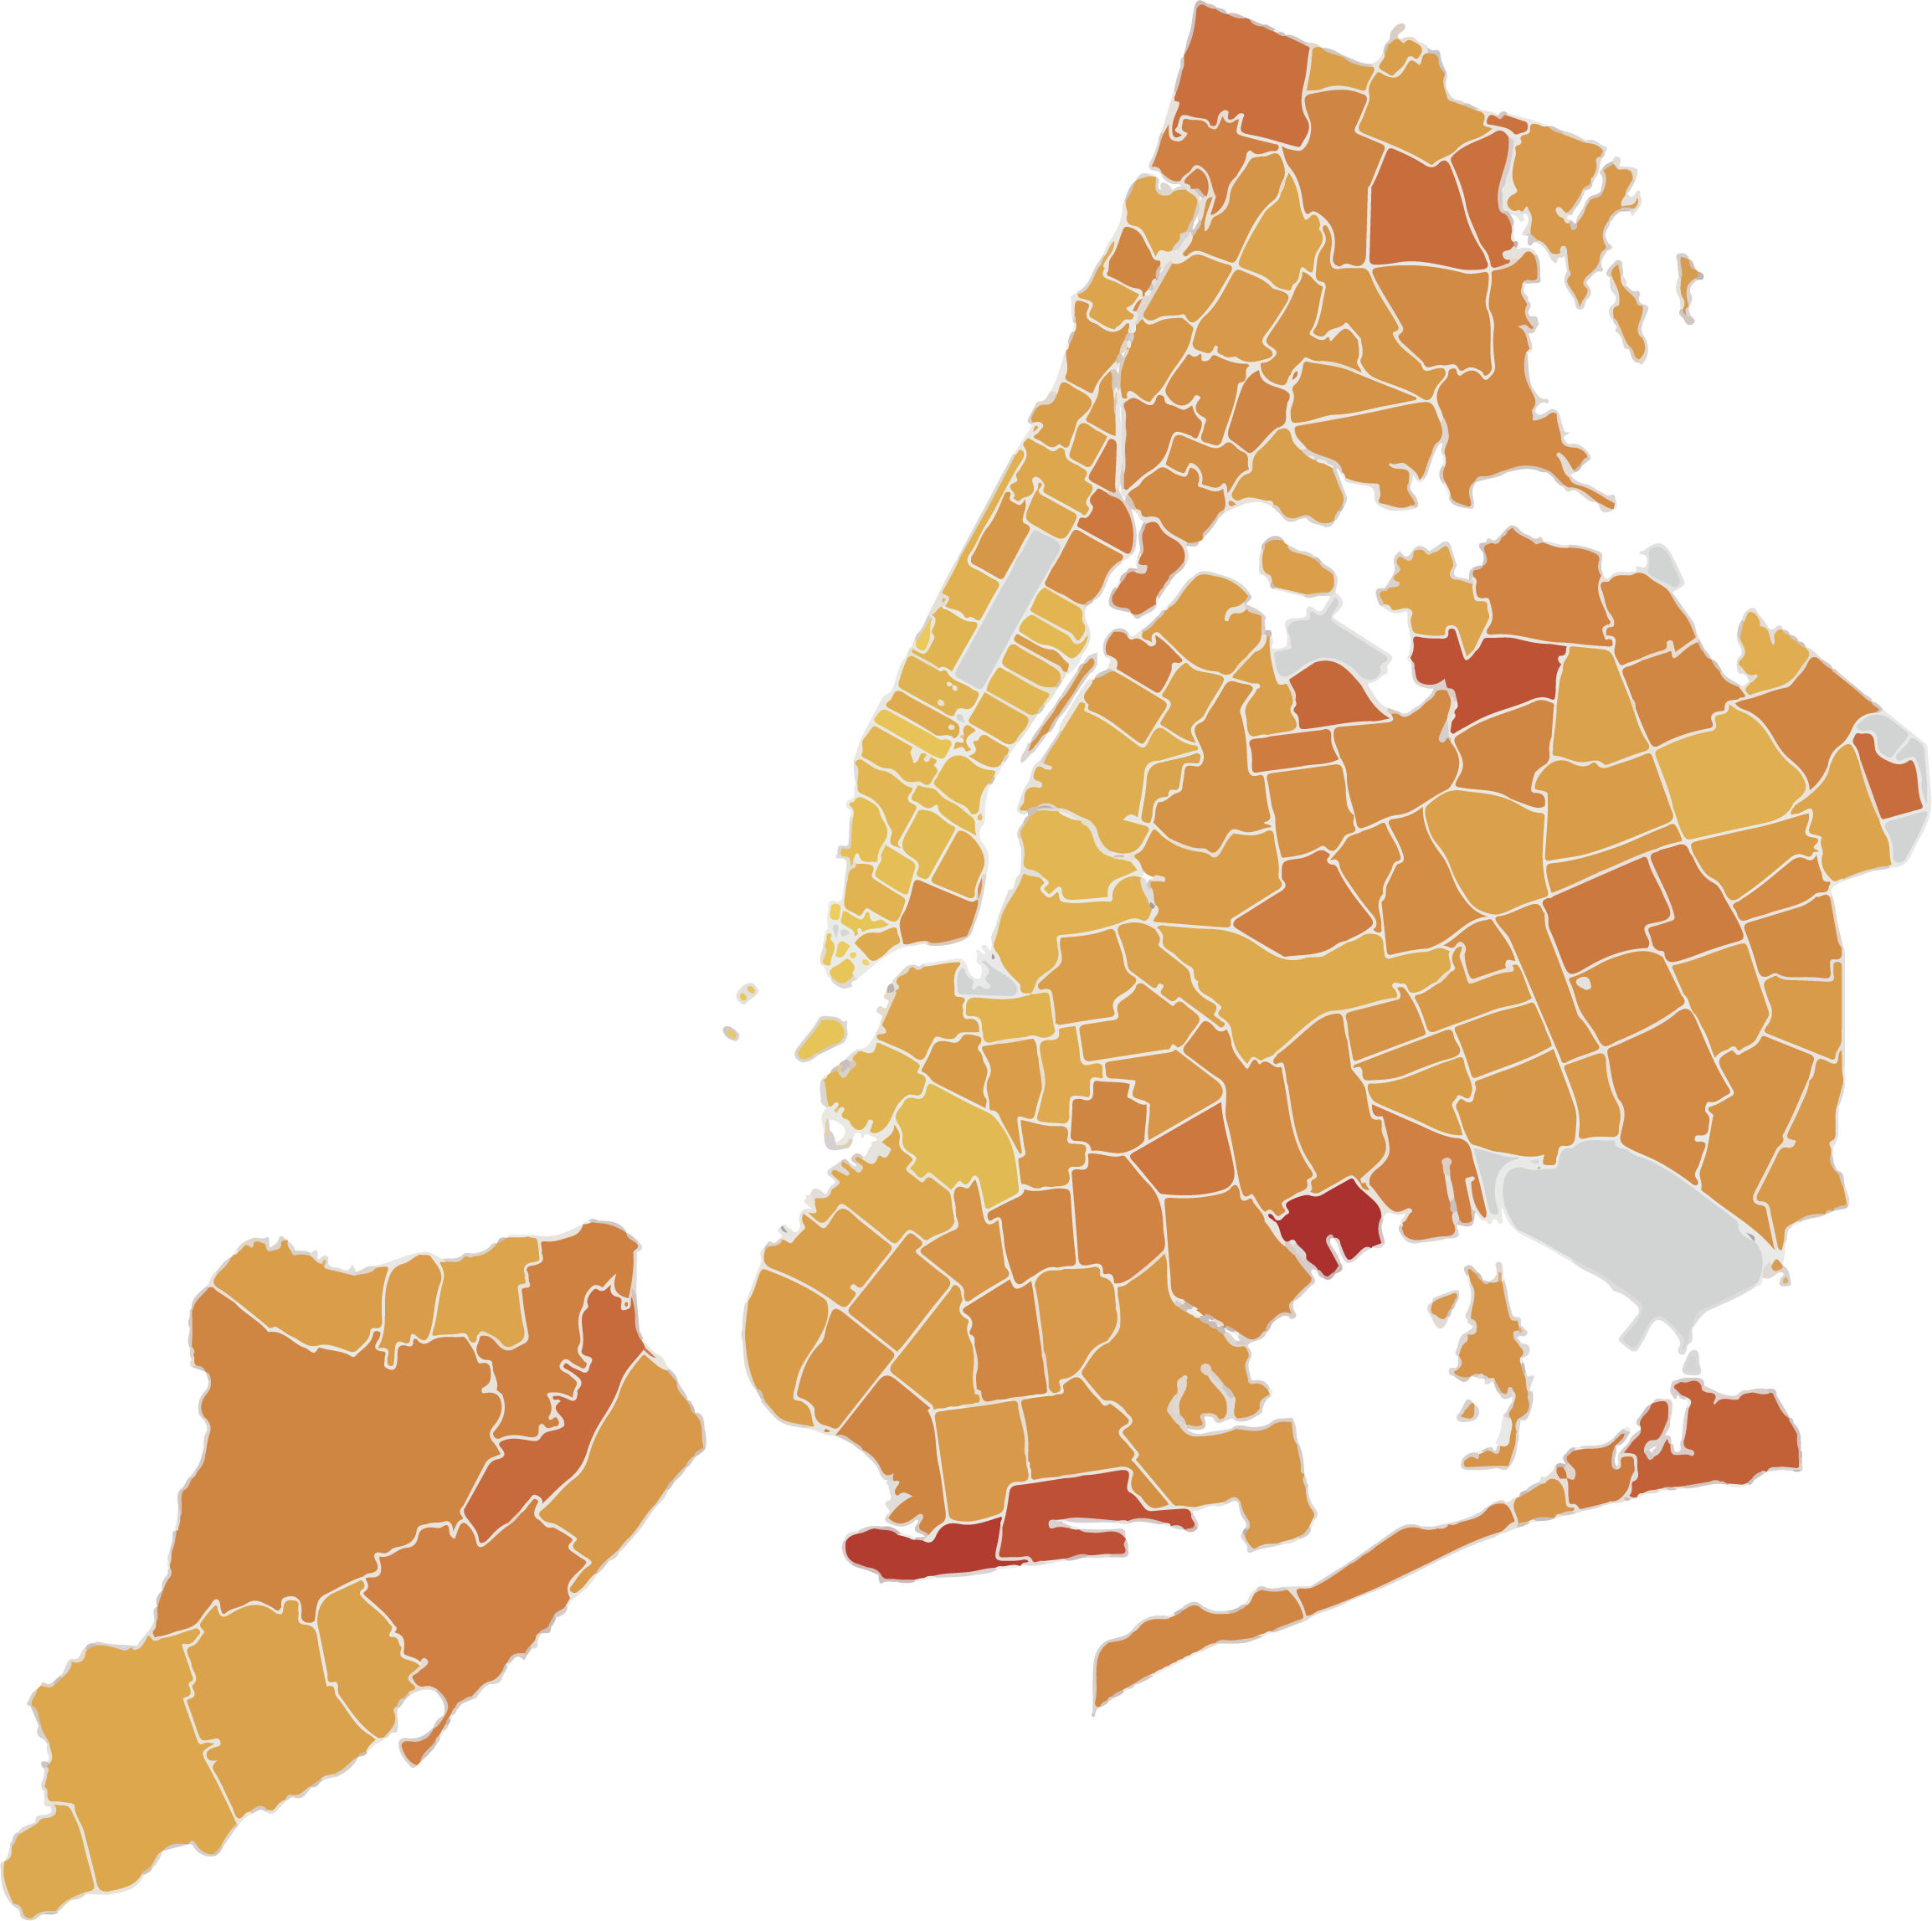
What is the correlation between where you live in New York City and the impact of the pandemic on the families in your neighborhood? What role does poverty play in the impact of COVID-19? How are poverty and geography correlated? The map pairs mortality data (deaths per 100K of each zip code) with the median income of each zip code. Explore different zip codes to see how income and death rate are related.
Structural racism, structural inequalities and historical discrimination enforced through law and custom from the federal to the state and neighborhood level are at the root of the disproportionate impact of COVID-19 on racial and ethnic minorities.
Over the 3 year span of the COVID-19 pandemic, several articles have been written about COVID-19 in NYC neighborhoods and zip codes. Browse articles by borough or review some comparative analyses of the impact of COVID-19 by neighborhood.
As we have seen, New York City is an unfortunate poster child for the disparate impact of COVID-19 based on geographic location. A breakdown of COVID-19 cases and deaths across the city’s zip codes reveals that where we live is more than a simple geographic distinction. Imbued in that geography are matters of life and death bound up in matters of wealth and poverty, race and immigration status.
GEOGRAPHY, INCOME, MORTALITY
HIGHEST MORTALITY ZIP CODES ACROSS NYC PER 100K
LOWEST MORTALITY ZIP CODES ACROSS NYC PER 100K
A key insight that emerged while we were developing the map visualization is the correlation between median income and the Covid-19 death rate. While this data is a bit noisy, it is clear that poor or low income neighborhoods suffered the greatest loss of life from COVID-19 and very high income neighborhoods suffered the least from the pandemic.
Poverty is a magnifier of misery and death of an order of magnitude that is striking. Let’s do the math:
The hardest hit zip code suffered 28 TIMES the death rate is the least impacted zip code while having a median income barely more than 1/10 the median income of the least impacted zip code.
Local government institutions must focus on combatting the structural racism and other inequities that make a virus like COVID-19 a heat seeking missile set on doing the greatest damage in poverty hot spots. Local and federal government agencies must take a protective stance toward vulnerable communities.
MORTALITY & INCOME ACROSS ALL NYC ZIP CODES
explore the data
Our interactive map visualizes the up-to-date total coronavirus deaths in each New York City zip code in addition to the population impact of the virus by zip code.
Beginning with the earliest available data (May 18, 2020) when the office of then Mayor DiBlasio finally began to release zip code specific data, this visualization reveals the disparate impact of COVID-19 on NYC residents within the 302.64 sq mile area of New York City’s five boroughs.
The data sources include NYC Coronavirus Disease 2019 (COVID-19) Data beginning on May 18, 2020.
Structural Factors that Affect the Rate, Severity and Deadliness of COVID-19
NYC Data on Measures of Social Wellbeing by Neighborhood
Data on several measures of social wellbeing including economic security/poverty, air quality, educational opportunities, residential quality, chronic health issues, access to quality healthcare etc reveal tangible disparities between different economic and racial groups.
NYC Essential Public Health Data Resource
Several datasets made publicly available by New York City’s Department of Health and Mental Hygiene (DOHMH) reveal the persistence of structural racism in New York City. This online resource provides public access to the data AND ways to explore and visualize the data to derive a deeper understanding of the consequences of NYC’s segregation by race and wealth.
The data and website provided by NYC DOHMH are essential companions to the COVID-19 Impact Project NYC COVID-91 Mortality Map.
NYC DOHMH Useful Links
Click on the links below to explore the NYC DOHMH data. This takes you outside of the COVID-19 Impact Project website.
Social Wellbeing and COVID-19 Mortality
New York City is one of the top ten most racially segregated cities in the United States.
(Reference/Caption): Most to Least Segregated Cities in 2020
According to 2020 Census Data
UC Berkley © 2023 Othering and Belonging Institute. All rights reserved.
Enforced in the boundaries of this geographical racial segregation is a historical disparity in the determinants of social wellbeing. These disparities include job security, food security, access to equitable healthcare, air quality, economic security, fair and equitable housing, educational achievement etc.
For all measures of social well being, racial and ethnic minorities – particularly Black, LatinX, Indigenous and Asian Pacific Islander groups lag behind White Americans.
The COVID-19 Impact Project is intentional about explicitly framing conversations on disparities in health outcomes for racial and ethnic minorities through the lens of structural racism AND AVOID the historical tendency to blame individuals and/or ascribe biological rationales for these disparities.
Users of this resource can compare and contrast NYC neighborhoods divided according to community districts. The measures of social wellbeing are the following:
Scholarly Articles on Structural Racism and COVID-19
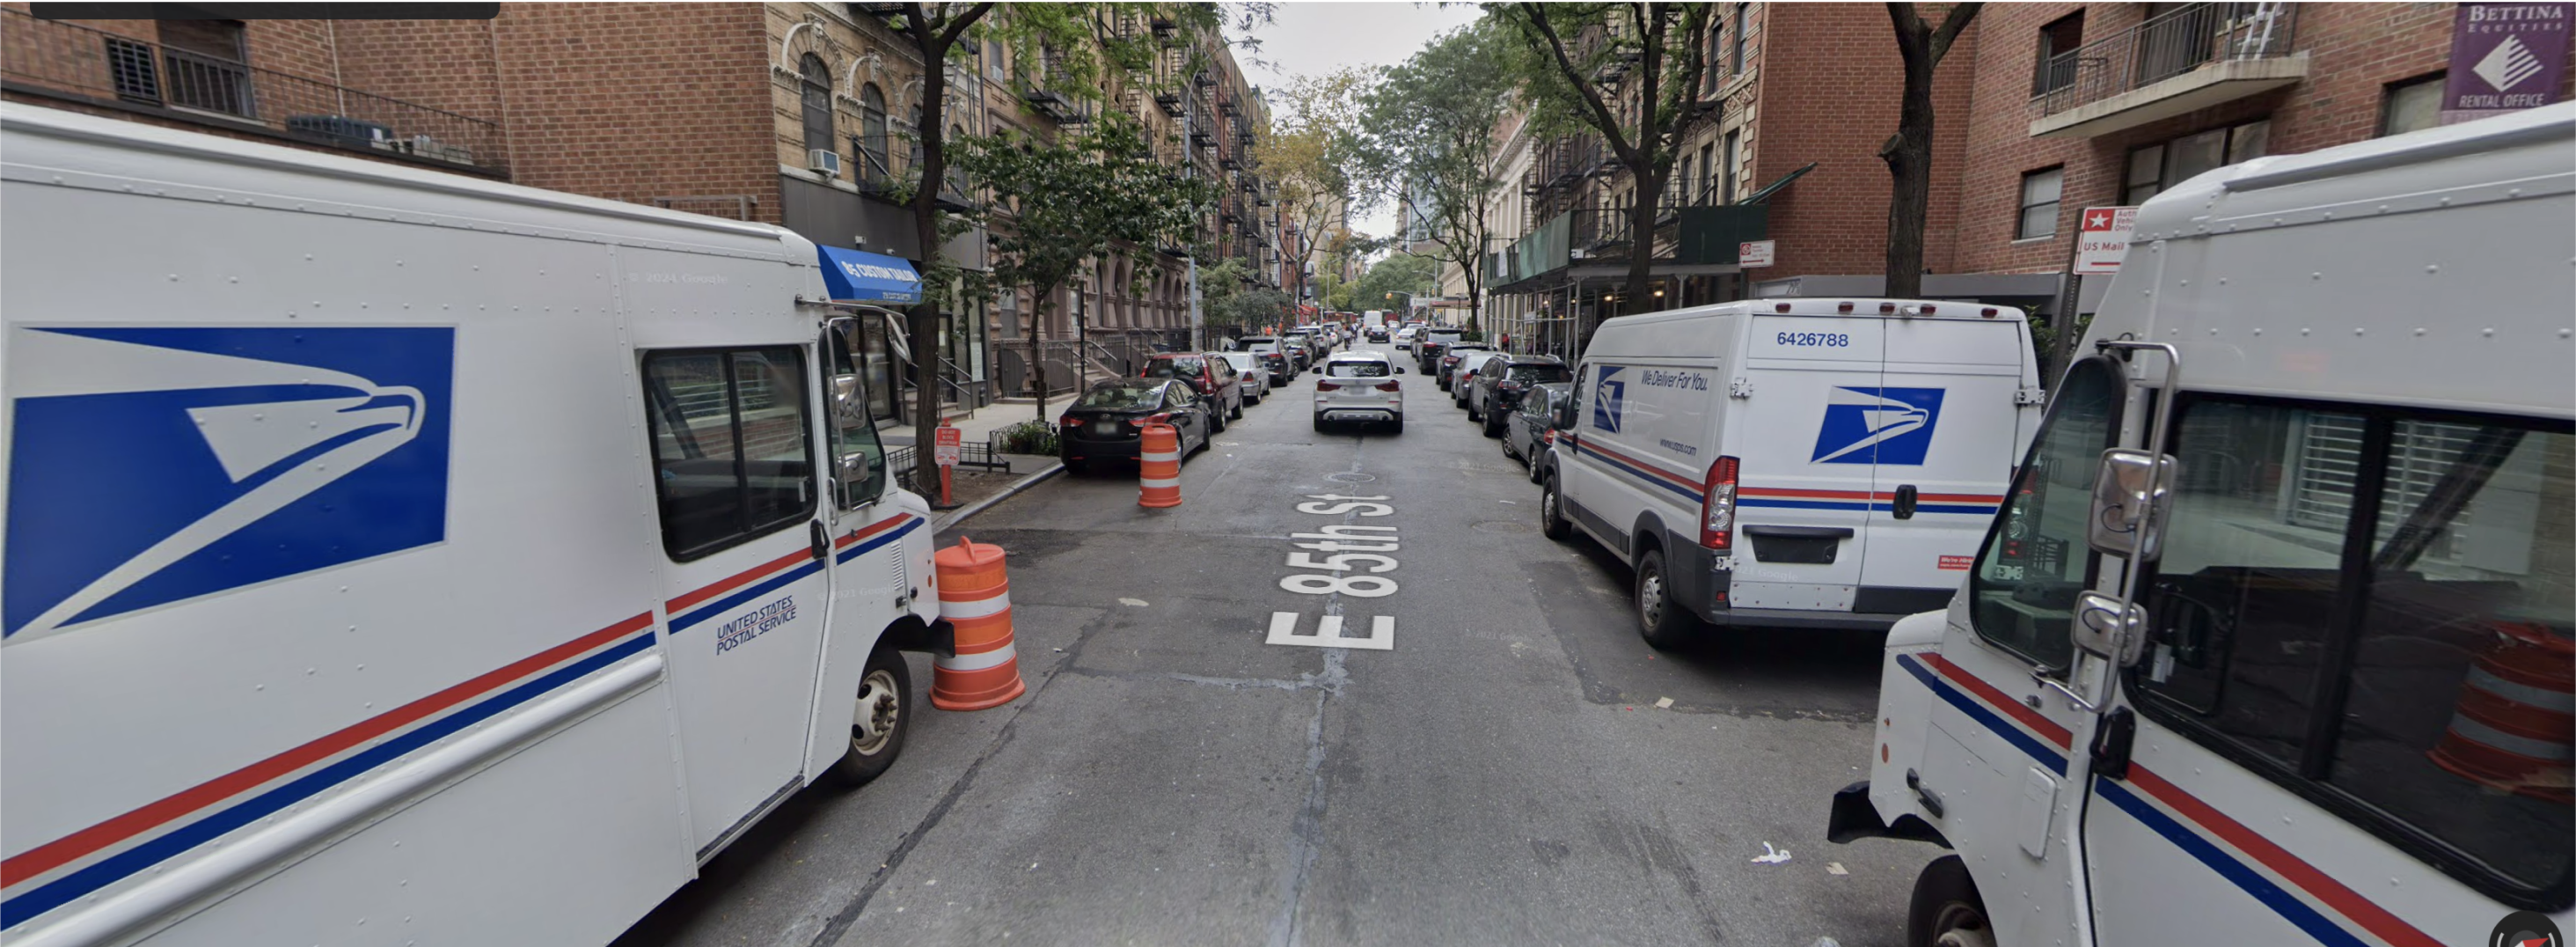
Manhattan
Bronx
Queens
Staten Island
Brooklyn
Comparative Analysis Across Zip Codes
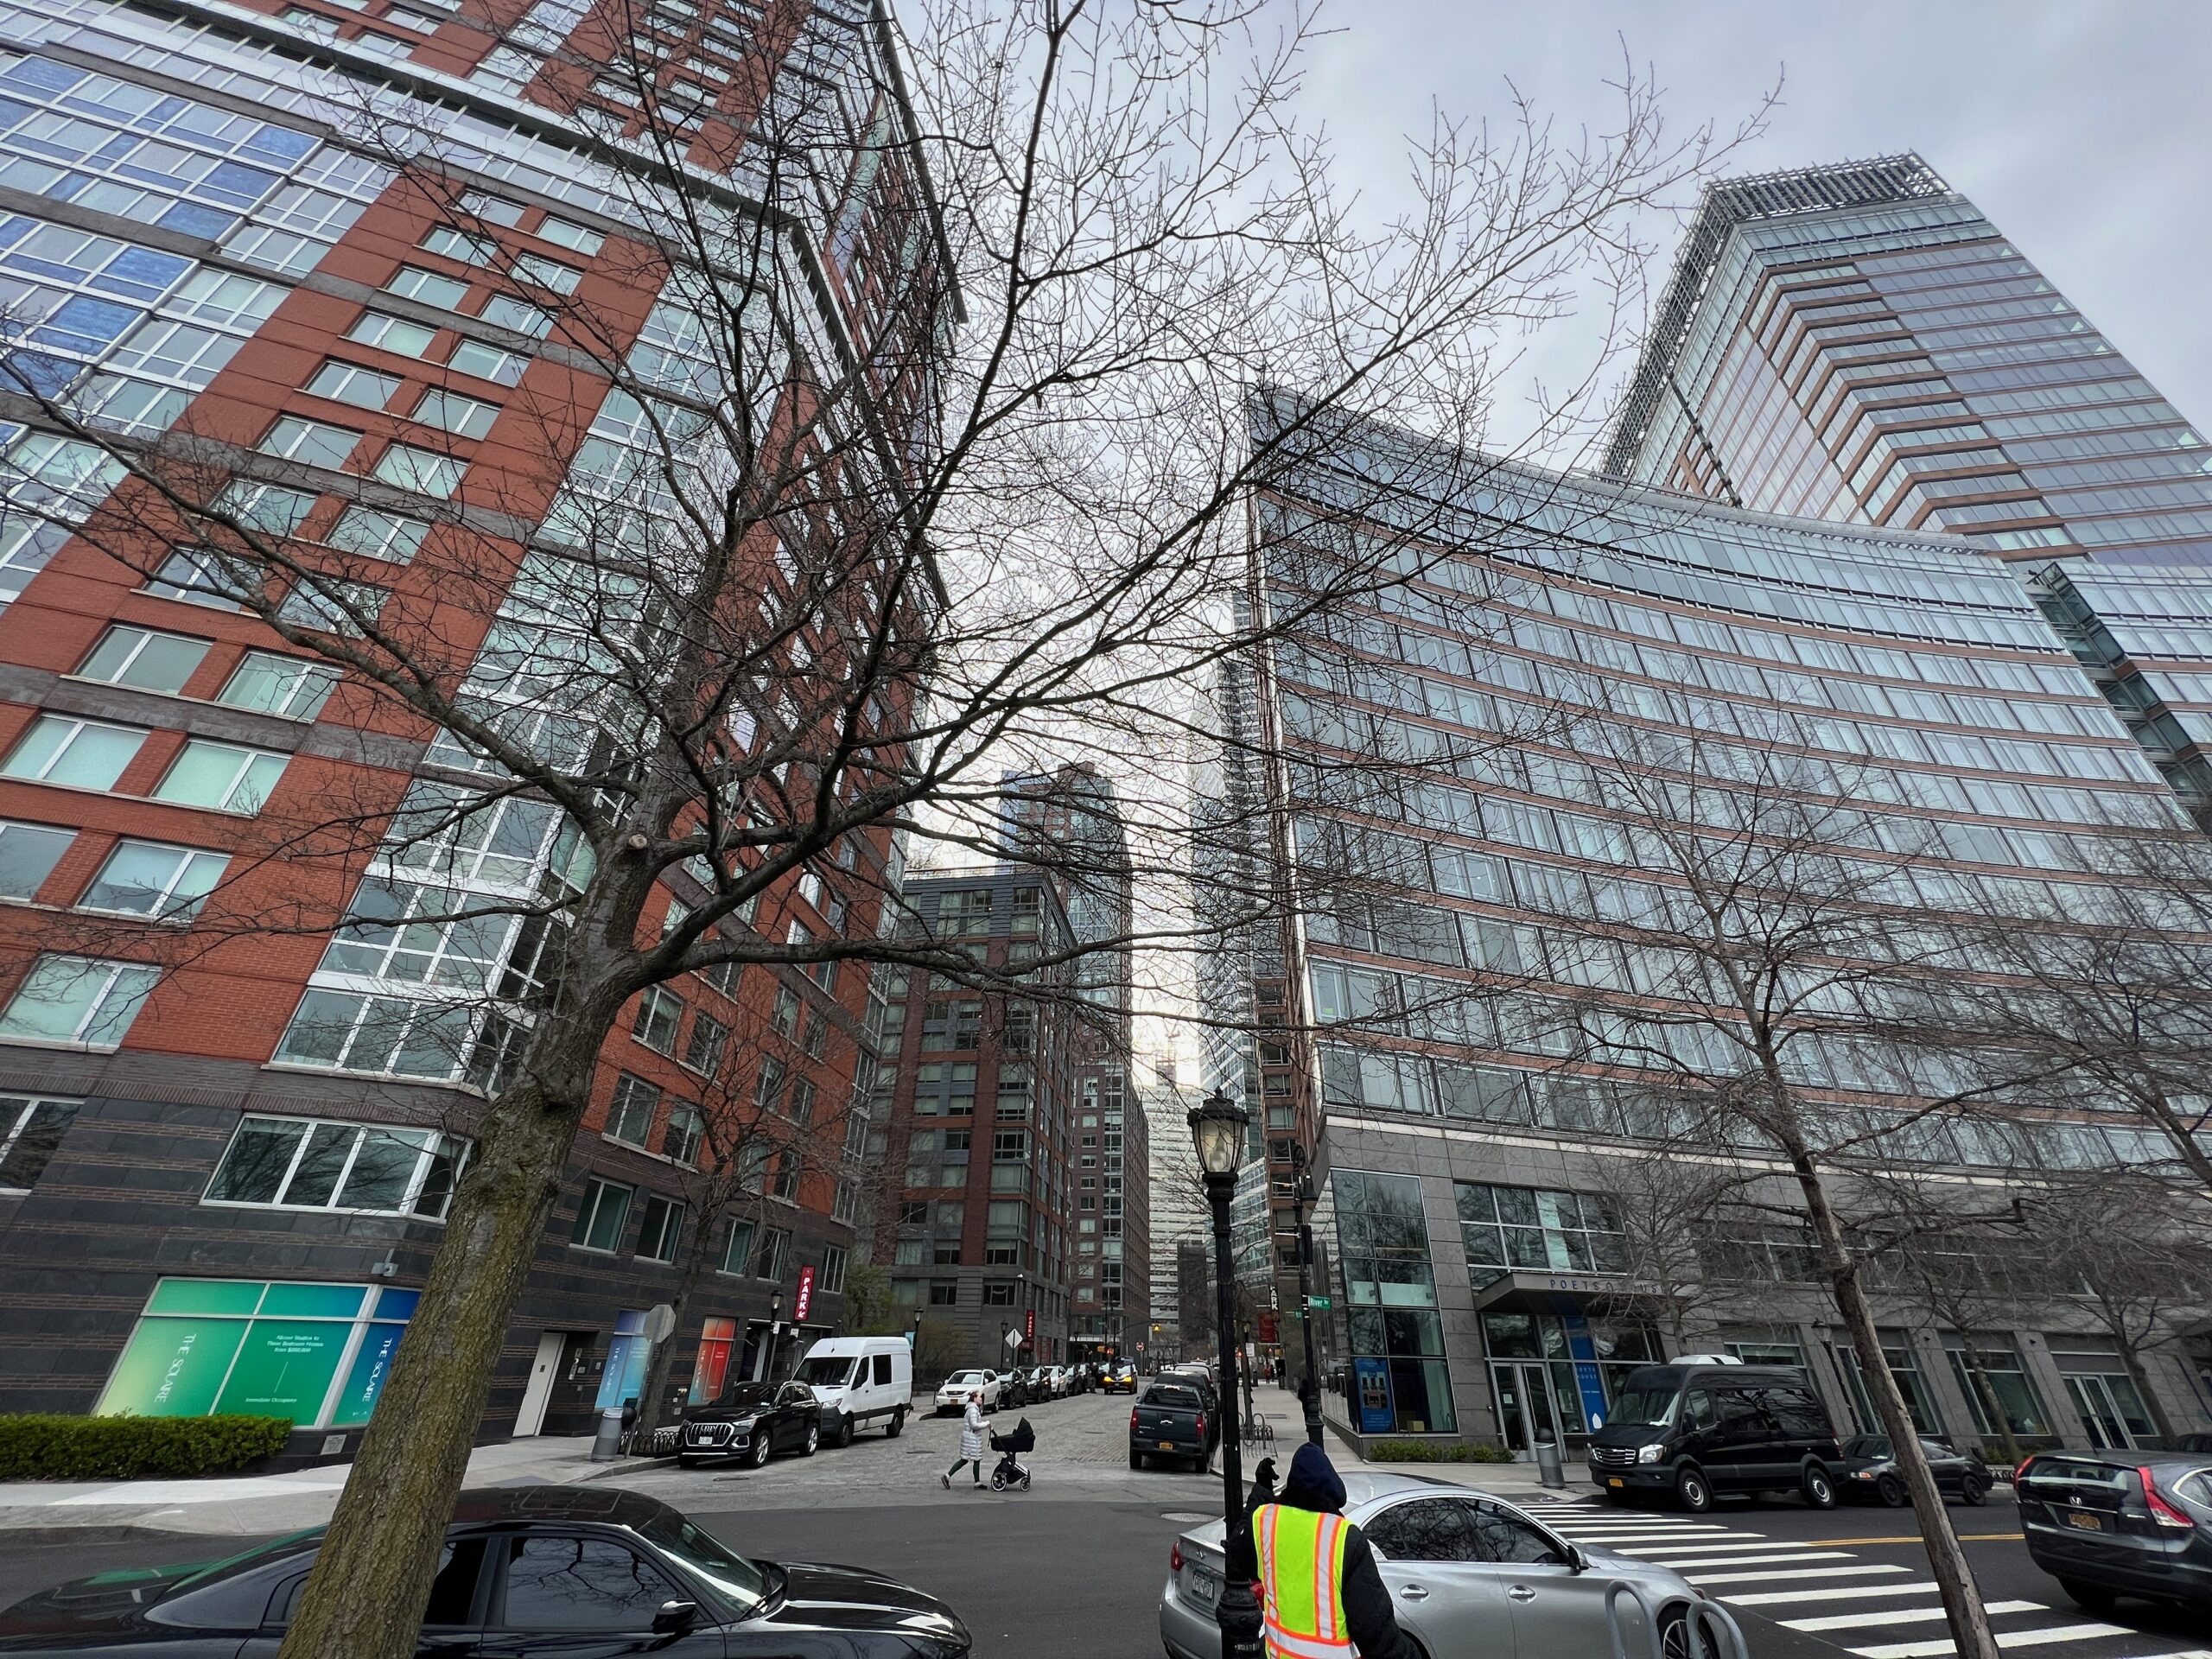
Battery Park City
Brooklyn
Bronx
Queens
Staten Island
We encourage you to use our tool and other publicly available data to further explore the questions of COVID-19 and geography. There are many stories to be told. Will you contribute your story?