

David MIller
Quantaproject
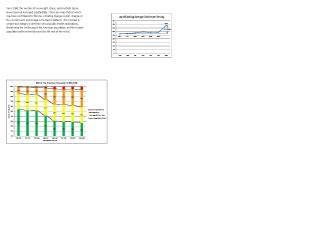
A simplifying visual explanation of how we got into a complex predicament: the obesity epidemic.
This is a project for Expression Frameworks for Information Visualization
http://davebmiller.wordpress.com/2010/11/07/quantaproject-2/
Classes
Expression Frameworks for Data: Information Visualization
Expression Frameworks for Data: Information Visualization
Quantaproject uses static and dynamic visual representations to tell the story of a complex problem in understandable terms. The obesity epidemic is a result of policy, technical, and biological factors, all combining to lead to a detrimental condition for the public, and a crisis for the health system. Quantaproject, as its name implies, quantifies the contribution of the antecedents to the end result, making it possible to understand what is going on, and therefore being able to act appropriately at multiple levels to address the problem. Relying on Bob Horn's concept of Mess Maps, infographics, and interactive explorations, Quantaproject is a new way of telling a story, using a visual language.