John Henry Thompson
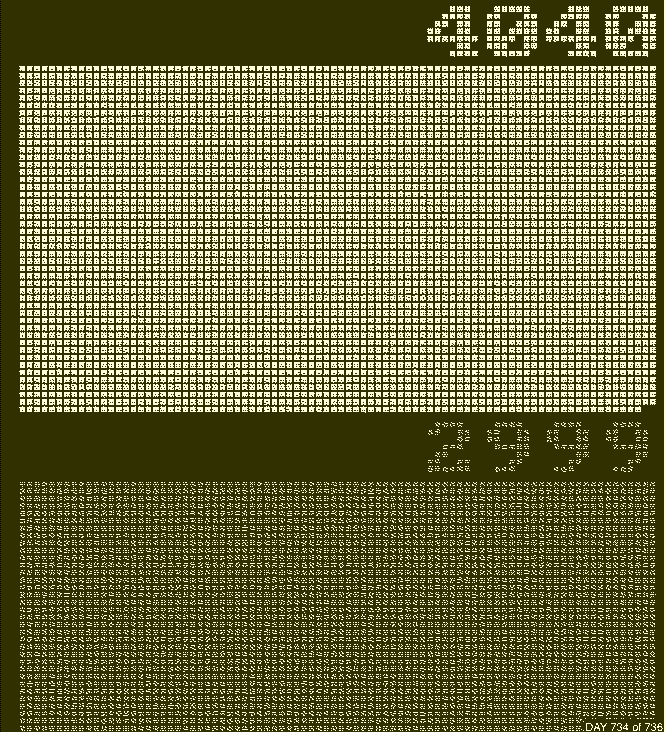
This course will use the open source COVID-19 Impact Dashboard as a basis to explore ways to humanize the unfolding data on the coronavirus pandemic. Students are invited to collaborate on the COVID-19 Impact Project. Students will discover how data flows from public GitHub repositories and tools needed to visualize the data. We will review other data-centric open source projects related to COVID-19 and discuss the questions they are trying to answer or problems they are trying to solve. We will examine historical and contemporary data visualizations. Using data visualization as a scaffold, we will explore ways to support community driven mourning and memorialization. Students can choose to participate as JavaScript coders, p5js explorers, UI/UX designers, citizen journalists, or data science explorers.