

Asli Aydin
You Are What You Drink
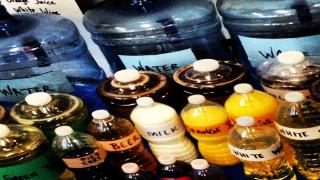
A Physical Data Representation of the liquids that entered my body for a month in November 2013. I am literally quantifying myself in terms of ounces.
http://asliaydin.net/data-representation/
Classes
Data Representation
Data Representation
“You Are What You Drink” is a physical visualization experiment on the Quantified Self Movement. There is not a single step we take in which we don’t produce data. At least that’s how I’ve started to see the world these days. Where I’ve been, the weather, the time, the people I was with, the environment, the ambiance, what happened during, how many steps I took to get there, what train I took, how I was feeling and many more of myself do I give out to the world voluntarily.
Taking this as a starting point, I wanted to see if I could collect some of this data manually and started writing down everything I drink in ounces everyday. I’ve been doing this for two months now and in this project I used data from November 2013.
Background
After listening to Felton in class, I started getting interested in quantifying myself (this has also been a topic in my DIY Health class) and I started tracking some of my data. One of these data was the amount of liquids I drink everyday. Even though this will continue to be an ongoing project for me, now that I have a months worth of data I want to physically represent my data. What makes the data interesting is the disproportion between the water and other 9 drinks I've been drinking throughout this period.
Audience
People who are interested in data, data representation and the quantified self movement.
User Scenario
My project will be a static installation with a sign on top of it that shows the amount of liquid in each container in ounces or liters.
Implementation
The installation will be made of water bottles of different sizes filled with liquids: water, coffee, tea, orange juice, milk, beer, wine and processo.
Conclusion
It's been very interesting collecting my data. First of all, I realized how it wasn't so easy to manually do it and required a certain discipline. Secondly, it's been leading me to questions like what does all this data mean and does it necessarily mean something when it stands alone. How can we use this data to improve our lives.. These have all been questions I've been asking myself all throughout this process.