Category Archives: Lauren McCarthy

ColorGuy

Yu Hu

A mobile app to help you grasp every drop of color in life

Description

ColorGuy is a PhoneGap app, which could take photos, choose colors from that photo and type in words to describe your emotion at that moment.

As we know, colors are powerful: people are attracted by colorful products, designers want to use colors to make things functional and beautiful, fashion guys want to express their styles by colors…

The goal of this application is to let people who love colors keep a diary of colors in their life, play with colors and form a good taste.

Now we have a computer version color piker to help use analyze colors in pictures, we also have a lot of applications about colors in apple store. However, none of them like ColorGuy, which could let you analyze the colors around you in life and play with colors whenever and wherever you want!

Classes

Creative Javascript

Sensing Auroras

Clara Juliana Santamaria Vargas

Mixing 3D printing, lights and feelings to help us encase things that we can't hold.

www.csantamariav.com

Description

Using light to communicate feelings, emotions and inner states trough beautifully design 3D printing objects inspired by intricate designs of traditional lanterns and knitting.

Classes

Appropriating Interaction Technologies, Appropriating Interaction Technologies, Designing for Digital Fabrication
Mister Mister

Kaini Zhou

Mister Mister is a website documenting the stories between me and all the men I slept with, as a way to probe today's online dating scene, hookup culture, and the building and fading of interpersonal relationships in a contemporary urban environment from a young woman's perspective. The website encourages audience to think about their own stories and appreciate whoever wrote a story in their lives.

http://www.kainizhou.me/?p=171

Description

This website Mister Mister is a collection of individual profiles of guys I slept with. They might be my long-term relationship ex, or someone I met on Tinder. For each of them, I review the experience, give him an advice, and leave a note to myself. Viewers can write back to me if they think they are one of the guys or have slept with one of them.

I do not hope this project to be a brag about my sexual history. Instead, I take a closer look at people's mentality of dating, hooking up and having sex in general, and question myself on my growth as a woman. All the reviews are not graphic in any sense, because deep inside I think they are all interesting human beings. This is also a mark on myself to pause my online dating/hookup journey, and think about what I really need and want in this city at this age.

Classes

Comm Lab: Networked Media

Top European Soccer Teams' Source of Talents

Lutfiadi Rahmanto

Visualizing top european soccer teams' source of talents, buying renowned players, under radar or nurturing their own.

http://ucl-team-composition.herokuapp.com/

Description

This data visualization shows where teams that play in UEFA Champions League (UCL) get their players from, whether from stronger or weaker team. Holding the most tweeted sport event in 2012, UCL is one of the most celebrated sport event in the world. To draw a comparison, UCL is to Europe as Super Bowl is to USA. (Further explanation http://ble.ac/1Aezofu)

The story behind this, is each football team have their own method to build their squad. Teams who are recently bought by ultra-billionaire tend to go on spending-spree luring well-established player from top teams. While there are teams who have scouts with keen eye to recruit talents under the radar. And there are teams who rely on their own academy, nurturing young talents. The order of strength of the teams is defined by UEFA Ranking (http://uefa.to/1jZYau4) that measures performance of teams who play in European continental competition.

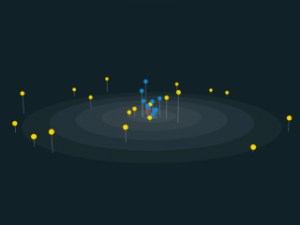
The visualization will be depicted in 3D cylindrical coordinate, where each players are represented as spheres. The closer the sphere to the center means he comes from stronger team. There is also a circle on the plane to show the the difference in ranking between his current and previous team. The color of the sphere represents categorical variable (whether they come from stronger team, weaker team, or club's academy).

From this visualization, there are several stories that could be noticed. England clubs tend to buy players from strong teams. Top three teams (none are from England) trust their own academy and have several homegrown veterans in their squads.

Classes

Comm Lab: Networked Media

Chasing Double Rainbows

Michelle Chandra

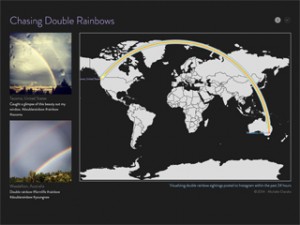
"Chasing Double Rainbows" visualizes the ephemeral phenomena known as double rainbows by mapping geo-tagged photographs posted to Instagram in the previous 24 hours (chasingdoublerainbows.com) .

http://www.chasingdoublerainbows.com/

Description

Chasing Double Rainbows (www.chasingdoublerainbows.com) visualizes the ephemeral phenomena known as double rainbows by mapping geo-tagged photographs posted to Instagram in the previous 24 hours. The visualization connects users who witnessed a double rainbow closest in time to each other by drawing a rainbow arc between each sequential sighting.

The visualization was inspired by a YouTube video by Paul “Bear” Vasquez whose effervescent euphoria for double rainbows captured the world. Today, Paul's video has over 40 million views. Chasing Double Rainbows is neither a scientific, nor serious visualization, but a facetious data art project celebrating the universal fascination created by the sighting of a double rainbow.

Instagram has over 350,000 public photographs tagged #doublerainbow. In a given 24-hour period, depending on rainy weather conditions world-wide and luck, Chasing Double Rainbows visualizes anywhere between 30 – 300 geo-tagged photographs.

A double rainbow is an optical illusion in which two rainbows are seen. The illusion is created by the reflection of two rainbows in a rain droplet.

A physical map visualizes real time data and was made using plexiglass, wood and cardboard. The continent where the most recent double rainbow was sighted is lit using neopixel leds.

The online visualization was built using HTML5, CSS3, JavaScript, jQuery, Node.js, Express.js, MongoDB, D3.js, Instagram API, and the Google Geocoding API.

Classes

Creative Javascript, Designing for Digital Fabrication