Mathura Govindarajan, Viniyata Pany
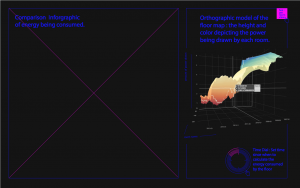
An installation that simplifies the concept of energy through a heat map of the energy usage on the ITP floor
https://mathuramg.wordpress.com/2016/05/02/energyviz-wip/
Description
Our aim through this project is to make the community aware of, and reflect on their energy usage. While we present only the data on the ITP floor, we will make the visualizations help the general community associate the numbers with daily facts and figures.
The project will involve installing an interactive screen that gives passers-by an easy-to-understand overview of the real time energy use of the floor, while providing the ability for the curious to examine the moment-by-moment data in more detail. This installation will visualize and gamify energy usage in the building through fun comparisons and contrasts of energy usage. Users will be able to look at and analyze the energy usage from any time in the past year up until the present moment.
The realtime energy data will be procured through the enertiv energy monitoring system. The visualization will be presented to users on touch screens along with a physical dial to set the time range.
Project Blog:
https://mathuramg.wordpress.com/2016/04/21/energy-updates-the-server-is-up/
Classes
Energy, Web Development with Open Data

