
Kate Godwin, Yu Ji
This light overlays dynamic daily energy consumption data with annual per capita energy consumption data to show where and in what quantities we are consuming power.
http://make.kategodwin.com/post/84556320194/sculpting-energy-data-into-light-this
Description
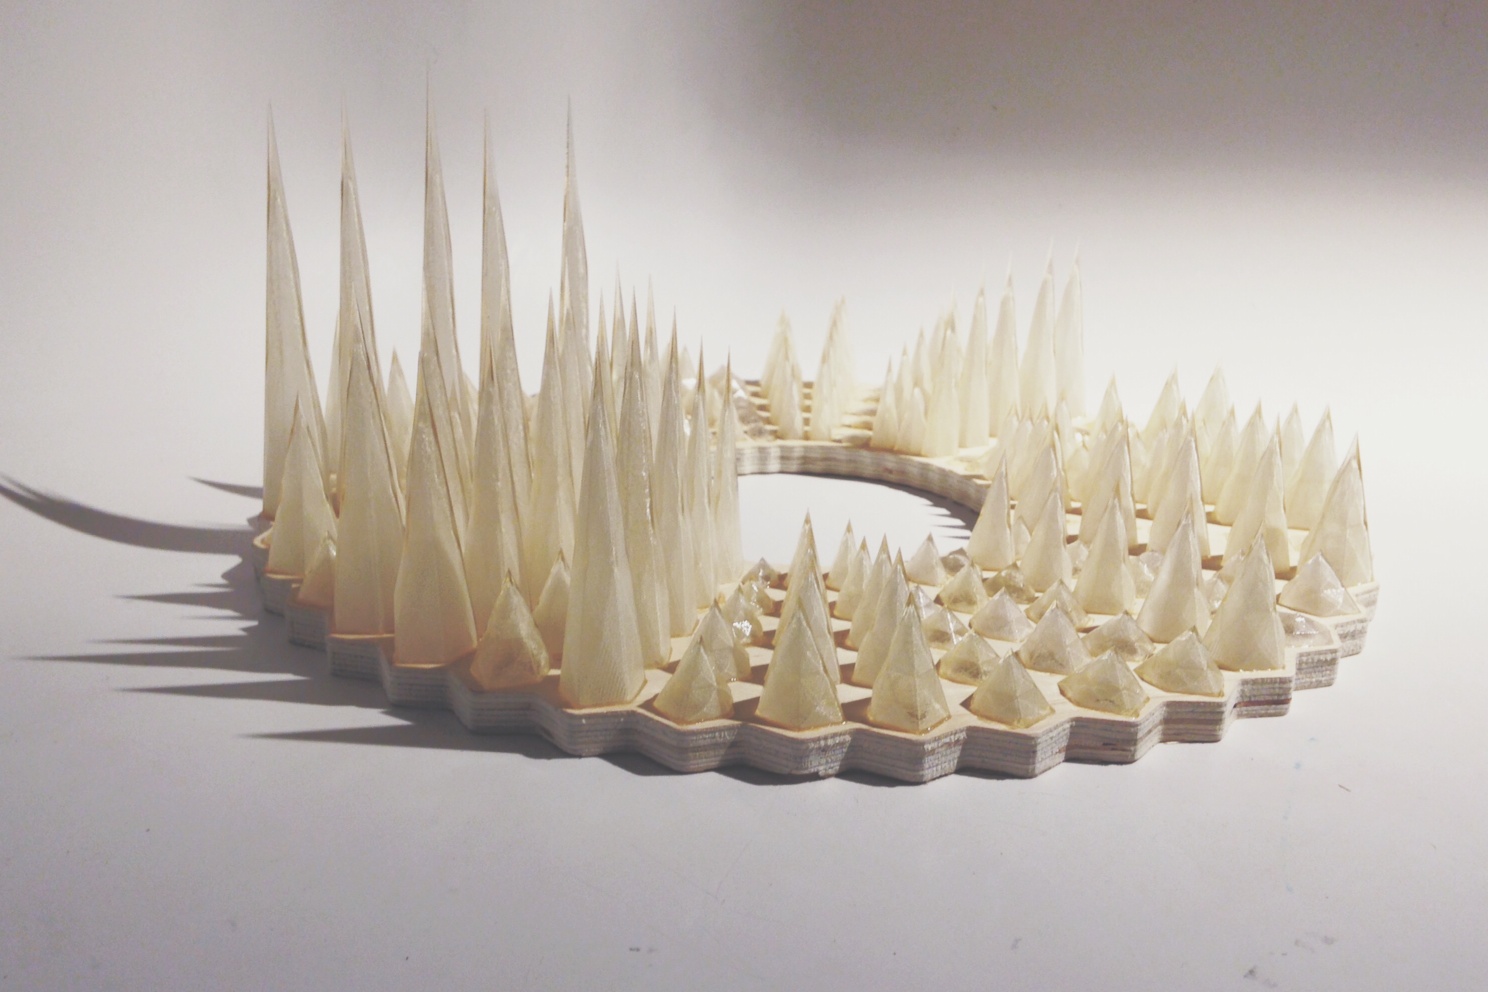
We began with five years of UN Electrical Power Consumption per Capita data from 41 countries from the years 1991, 1996, 2001, 2006, and 2011. To add another layer of meaning to this dataset we sorted the countries by the percentage of renewable electrical energy each country uses. Each data point has a pyramidal structure that was 3D printed in clear plastic to represent the former dataset. Each the 205 3D prints was sorted and then glued to a CNCed wooden frame.
Each printed data point will have a printed circuit with a surface mount LED. The brightness of the 41 sets of 5 LEDs will be controlled by an LED driver that is adjusting the intensity of the individual lights based on how much energy is generally consumed around the world at that time of day. One day will be mapped to ten minutes.
Classes
Circuit Design and Prototyping, Sculpting Data into Everyday Objects