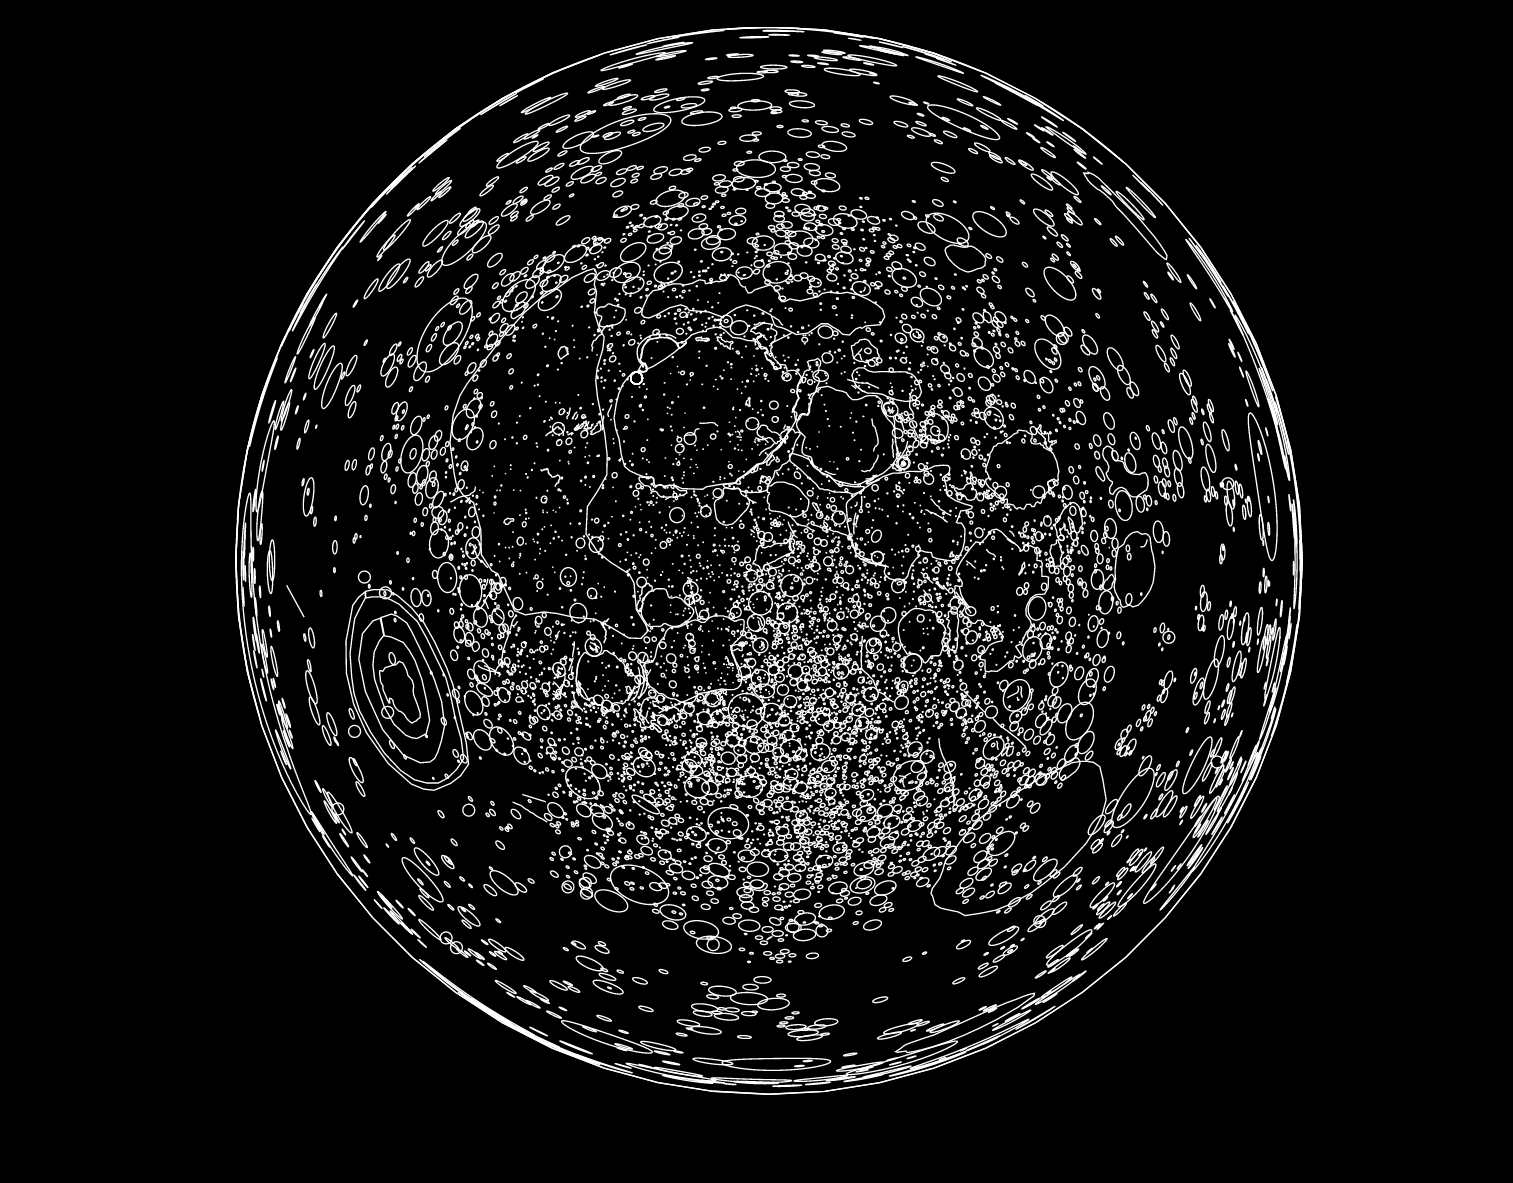
This project visualizes the TR R-277 report, also know as Nasa’s Chronological Catalog of Reported Lunar Events, and try to interpret this dataset with its historic background the “Space War”.
Lishan Qin
Description
The dataset I visualize is Nasa’s Chronological Catalog of Reported Lunar Events released in 1968, also known as the TR R-277 report. It was at that time the single most complete report of all observed lunar anomalies. It lists 536 pieces of records from 1500 till 1967 that include the date, the location, and the description of the reported abnormal lunar event observed from the earth. From the dataset, I can see a significant rise in the number of records after the Cold War began, the time when the historic event “Space Race” took place. Through the visualization of this report, my project intends to highlight the rise of the number of records during the Cold War to show the United States’ devotion to the “Space Race” and potentially their paranoia about being outdone in the race to the moon during the Cold War. While the TR R-277 may seem like an insignificant aspect of the US’s efforts in the “Space Race”, it is still a rather important project. By recording the Nasa’s observation of the abnormal events happening on the moon, it had helped the NASA to understand the moon, observe what they and their enemy are doing on the moon, and also to imagine what they and their enemy could do on the moon. After researching about the context and history of this data, I think that this dataset can show us three possible historic features. Firstly, the founding of NASA gradually contributes to the number of people devoted to the observation of the activity on the moon, which made the number of records at that time increase. Secondly, the tension of the race to the moon during the cold war had led to more research satellites sent to the moon which not only made the detected range on the moon wider but also made the number of detected activities increase. Thirdly, America's paranoia about the activities on the moon for fear of being surpassed in the space war has made their observation more careful and thorough. Thus, in my opinion, this dataset could reflect America’s devotion and passion about the moon during the time of the “Space Race”.