The Monthly Hogwarts: April

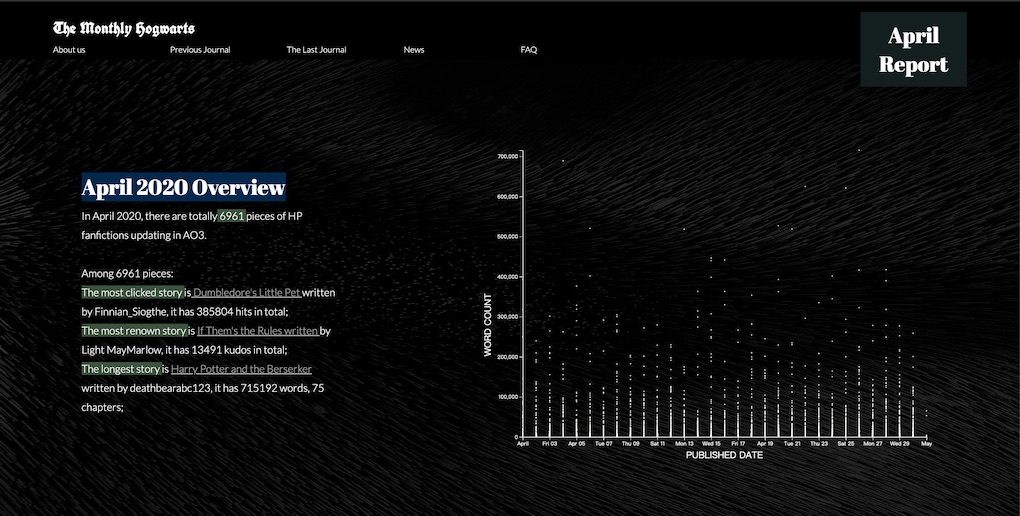
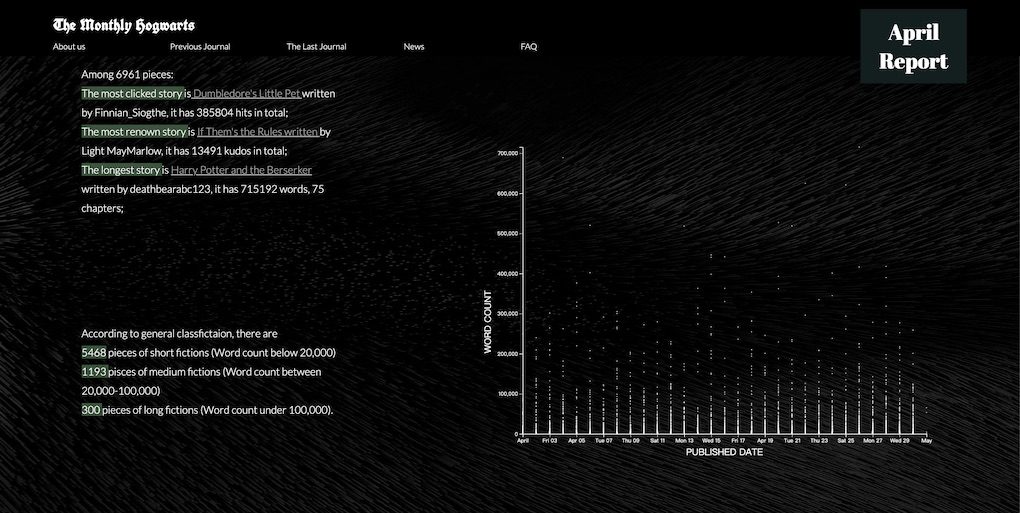
Hogwarts April Report is a data story about Harry Potter Fanfictions during April 2020.

Yu Sang

https://www.youtube.com/watch?v=Dbgz4gcTc_w&feature=youtu.be

Description

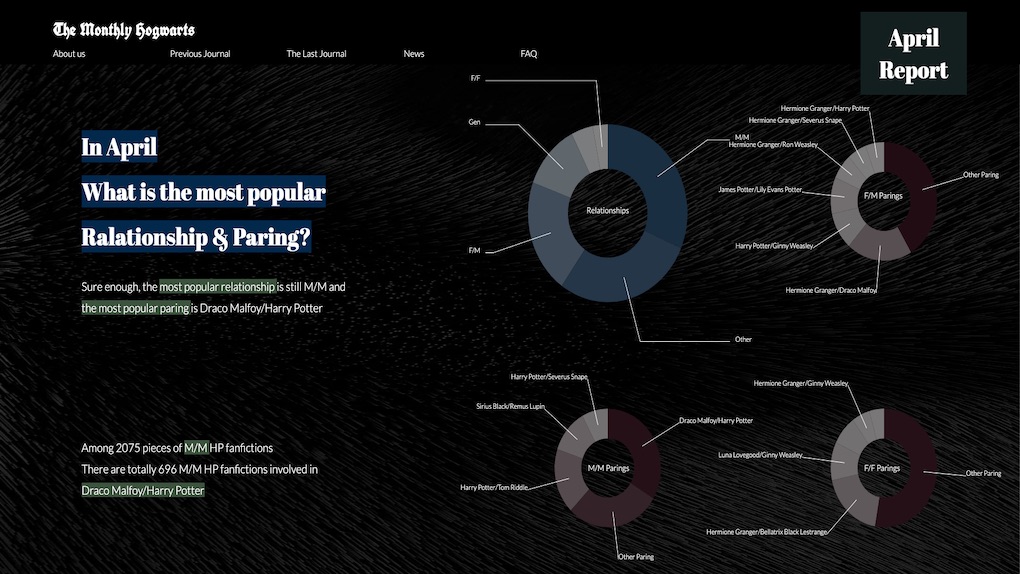
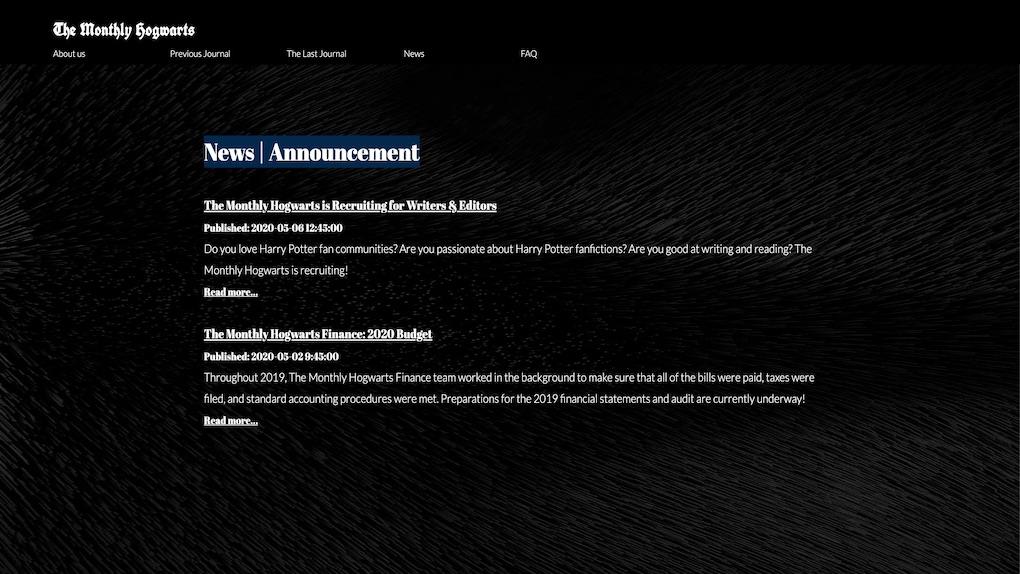
Hogwarts April Report is a data story about Harry Potter Fanfictions during April 2020. The subject of my final project is “Harry Potter Fanfictions”. In the era of the internet, the fanfictions community demonstrates great growth potential. In this interactive data visualization project, based on the most recent month HP fanfictions, I will demonstrate some aspects of HP fanfictions such as relationships, parings, fandoms, and imaginations. I design the website as an online monthly newspaper, it might be more interesting than the pure data analysis.

IMA/IMB Shanghai
Critical Data & Visualization
Culture,Narrative/Storytelling

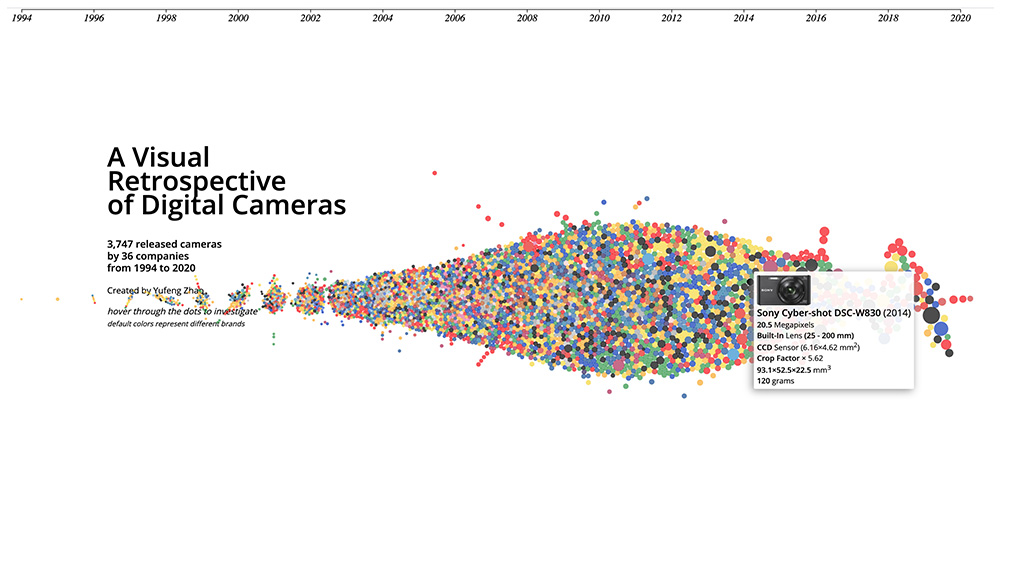
A Visual Retrospective of Digital Cameras

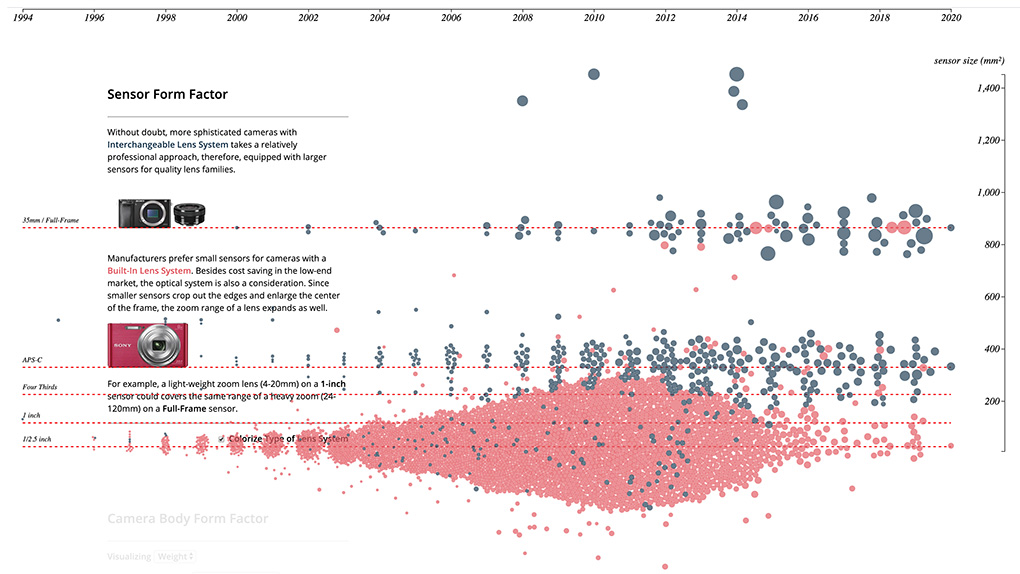
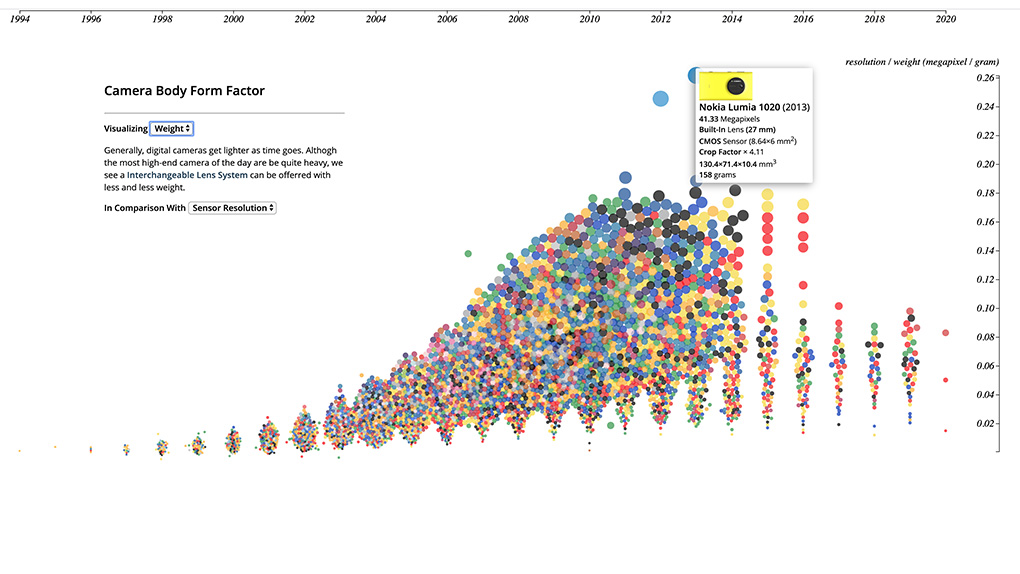
This project is a visual retrospective of digital cameras over the past two decades. With detailed information of nearly 4000 cameras, the visualization of any factor(s) in their technical specification will show the temporal development of this industry under the timeline. The project was created with great love and passion for cameras and photography.

Yufeng Zhao

https://youtu.be/W4DeT-xJcgA

Description

The technical specification of digital cameras gets evolved at a rapid pace over time. Or does it? By going through thousands of digital cameras ever released, the project Digicam in Specs uses specification sheets of cameras to address the change in the industry by interpreting the technology development, product design, consumer-centered business strategies related data.

IMA/IMB Shanghai
Critical Data & Visualization
Tool\\\\Service,Narrative/Storytelling

The Final Blessing

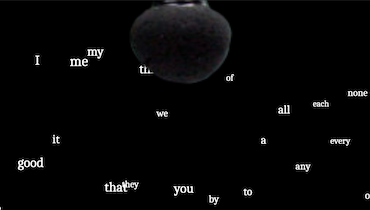
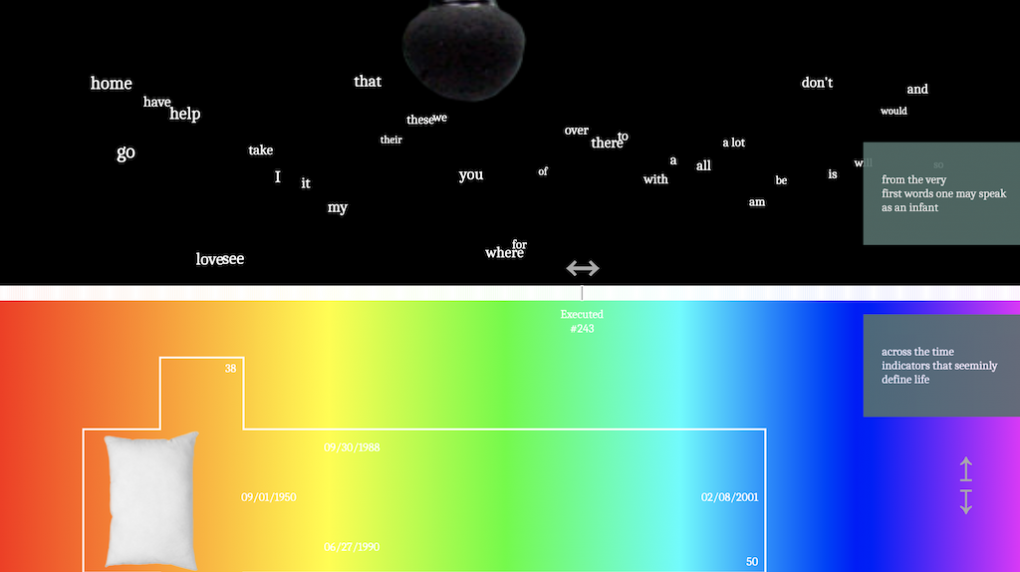
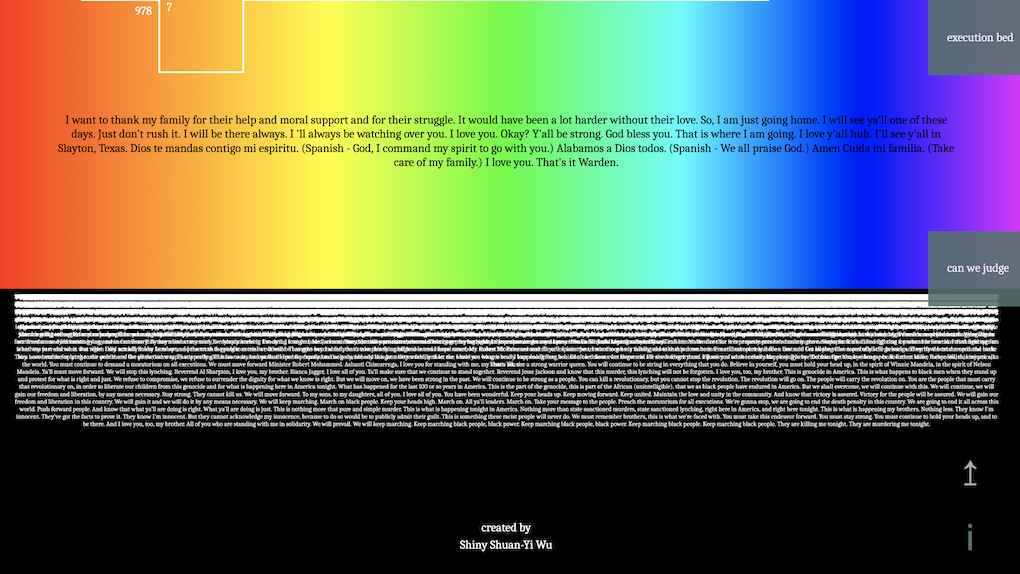
From the first words one may speak as an infant, to the last statement one may make on the execution bed, a timeless space in-between is created, questioning what “the final blessing” entails.

s

https://vimeo.com/418781754

Description

Texas is the state with the most executions in the US, with 569 in total up to date. These last statements from the executed offenders are controversially public information, but the dataset is pretty well-known and widely used. Bearing in mind the debate between justice and humanity, my project’s concept largely has to come to the evaluation of what is to be included versus what to be excluded. It’s also a dynamic between the collective “offenders” and each offender’s individuality. I decided to focus on the statements without the stereotypes of a person’s race, gender, etc. The other dataset from Stanford, A wordbank of children’s first words, came across immediately as an introspection of the thinking process. First words in life to last words in life. By cross-matching and visualizing the two datasets, the project creates a space for ponders of a person’s lifetime journey. We all become the witnesses of this final blessing as a symbolic act of rebirth, for the offenders or the victims. The project utilizes the features of different “time indicators” from the last words dataset: time of offense, time received sentence, etc. to visualize the seemingly definable extents of what happened and the timeless personal and social collective influences.

Is an act forgiven once the final sentence is executed? Is this a blessing for the offenders or the victims? Or perhaps, for us who are indirectly related to this social process? This website creates a space of imagination, contemplation, and introspection, from one's birth to death.

IMA/IMB Shanghai
INTM-SHU.204.1
Critical Data & Visualization
Narrative/Storytelling,Social Good/Activism
Happy 100,100 Times:)

What's the data visualization of happiness? Here is my version.

Qianyi Chen

https://vimeo.com/418501745

Description

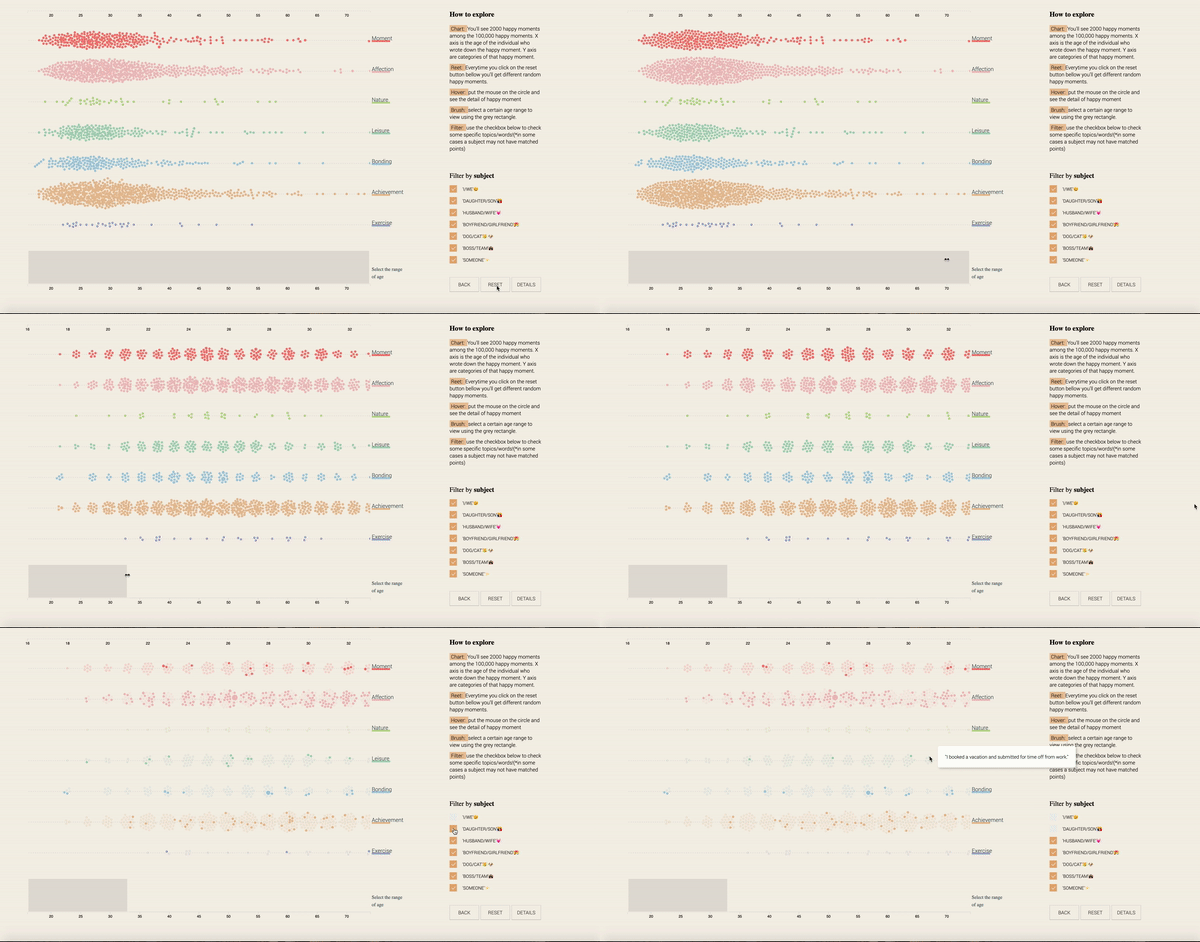
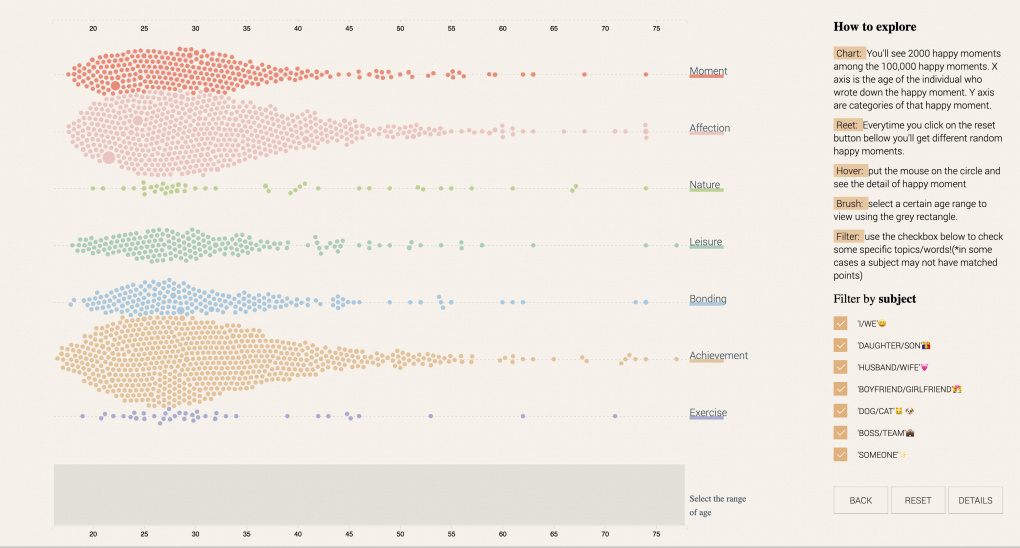
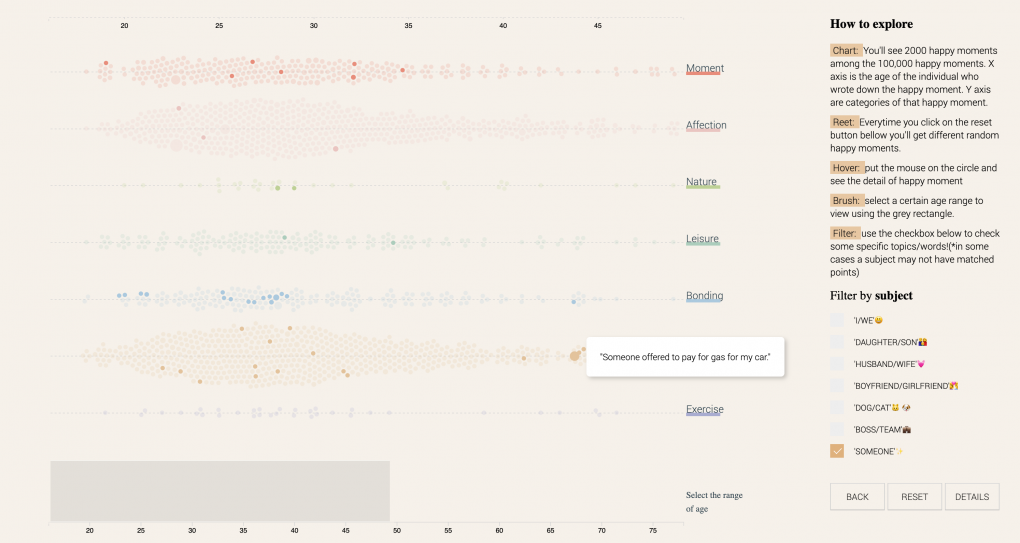
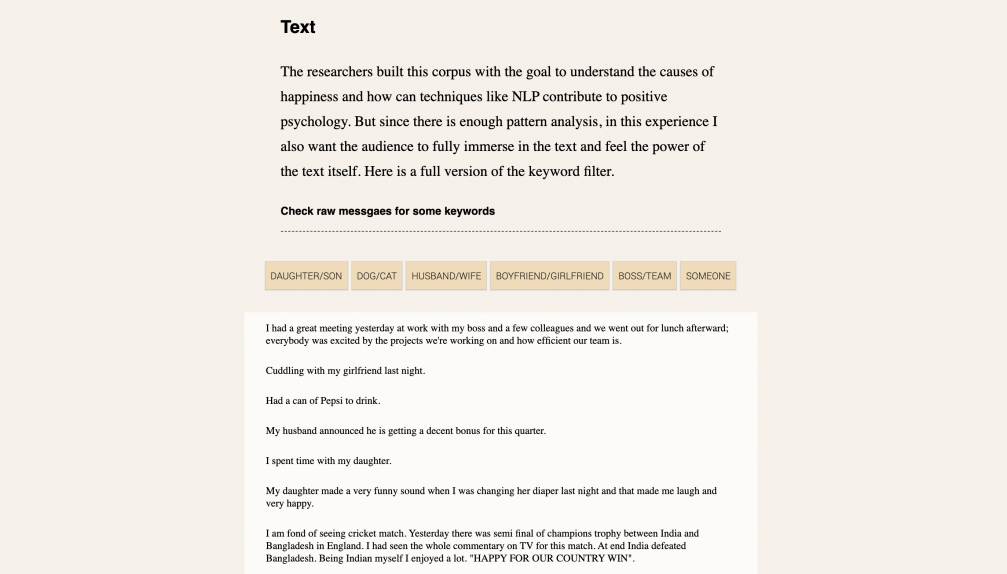
Instead of showing numbers that quantify the level of happiness of analysis about the reasons for happiness, this data visualization takes a more emotional path. Here the audience will be about to immerse in the exploration of 100,000 happy moments written down by different individuals. Features like filters and brushes enable the viewers to look closer to the moments and encounter surprises. Details about the dataset are also provided in the “details” page. (By clicking the details button the viewer can navigate to it.)

IMA/IMB Shanghai
INTM-SHU.204.1
Critical Data & Visualization
Education,Narrative/Storytelling

When sneaker become capital: an intro to sneaker market

When sneaker become capital: An introduction to sneaker market

Haoquan Wang

https://kenneth233.github.io/

Description

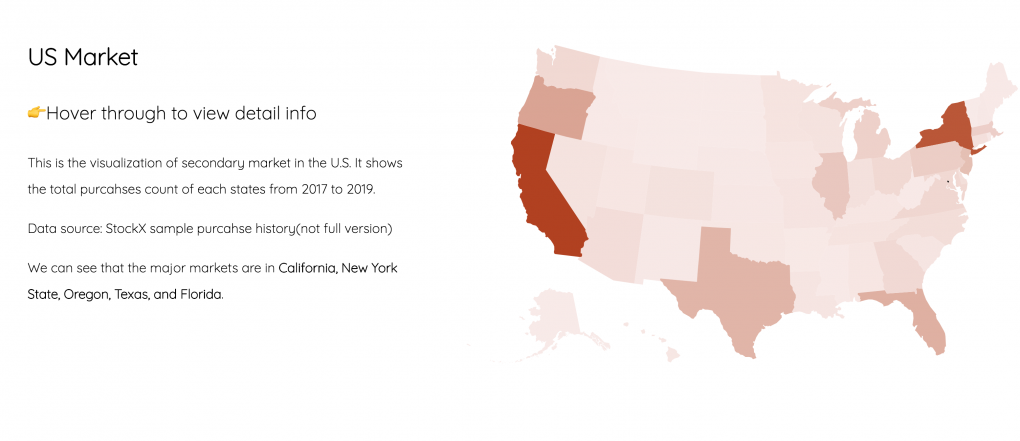
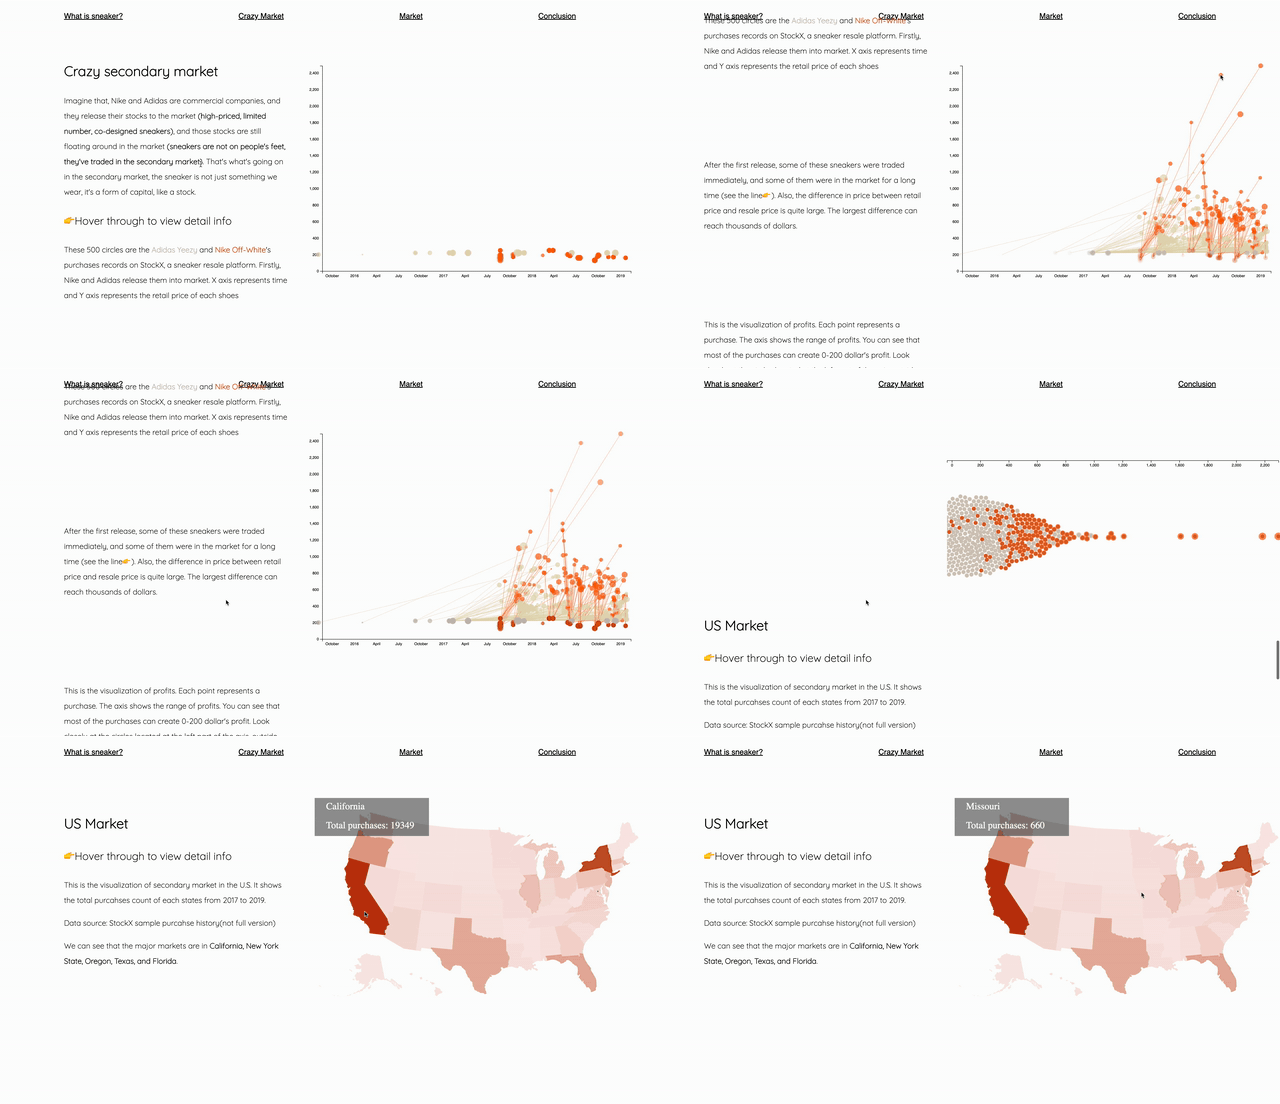
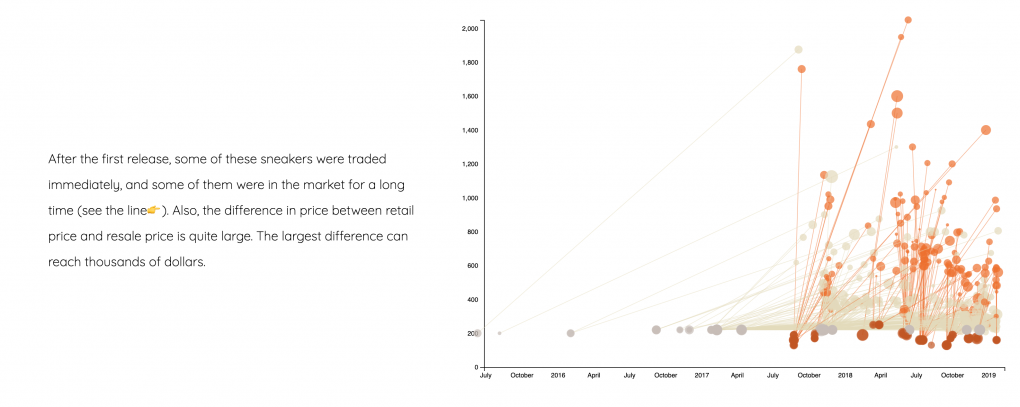
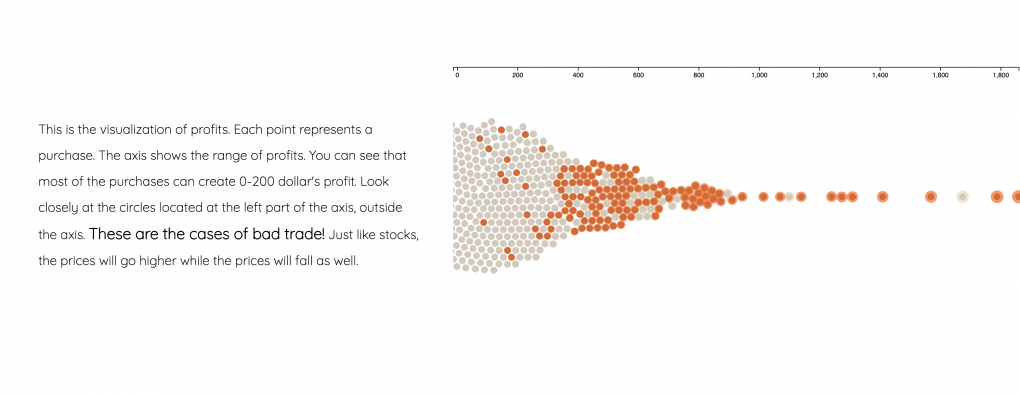
My project is an introduction to the sneaker market. In recent years, sneakers have become more and more popular. Sneakers used to be a subculture, but now more and more people are exposed to it. The sneaker market is also expanding. The rise of the reselling market is one sign. Through the analysis of the reselling data of sneakers, my project shows the marketized features of sneakers as a new type of capital: liquidity, high profit, and market distribution, so as to introduce an emerging market to the public.

IMA/IMB Shanghai
INTM-SHU.204.1
Critical Data & Visualization
Narrative/Storytelling

Superhero? Not so super on gender

A glimpse into the gender representation of superheroes through data visualization.

Zhinuo Wang

https://vimeo.com/user115539015/review/418787317/728527503c

Description

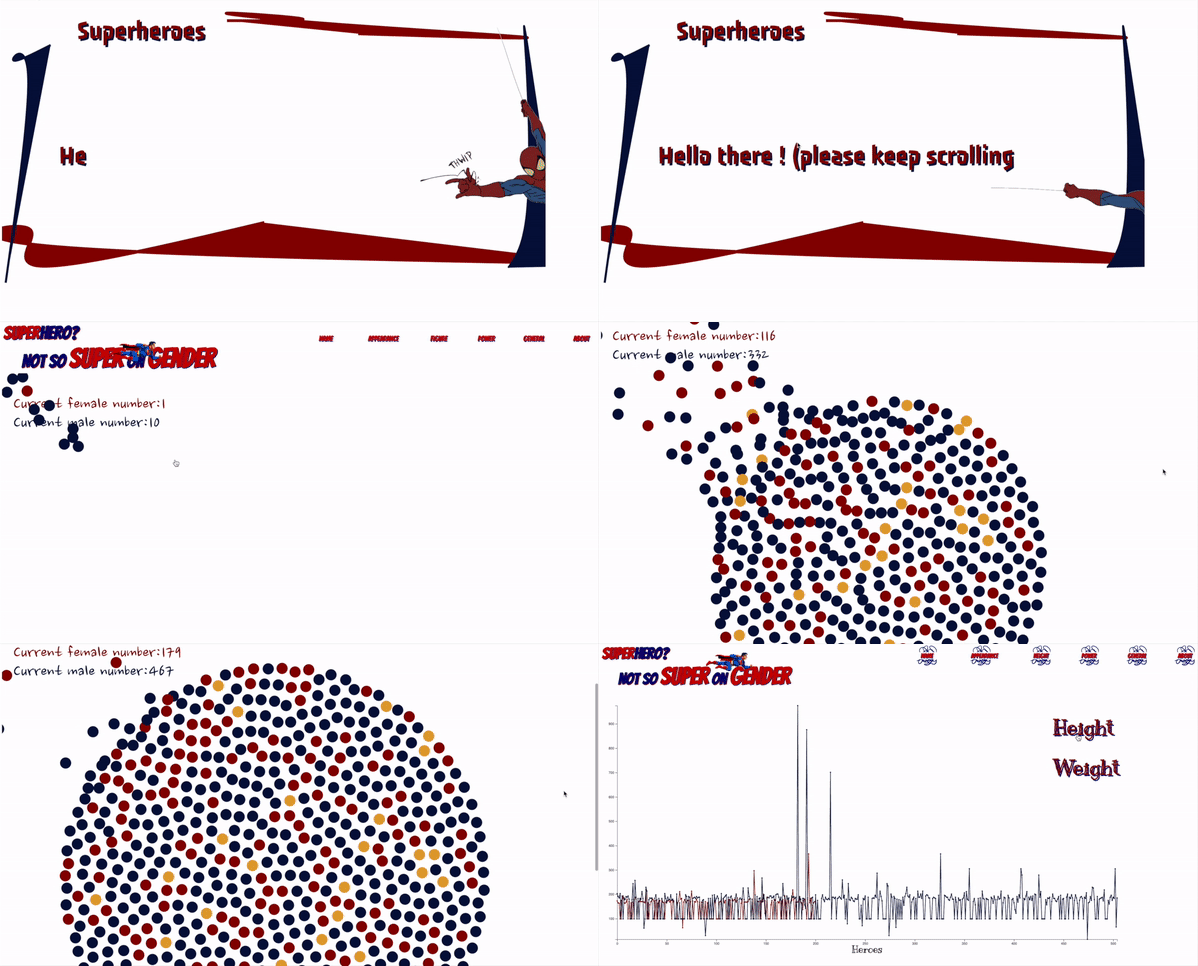
Being one of the mainstream cultures, the superhero has gained its global popularity. Along with its great popularity comes its huge influence, the superhero has become the model in both kids' and adults’ hearts. However, being a creation in the 19th century, there is a lack of diverse gender representation of the superheroes. By looking into more than 700 data points, this project aims at providing an insight into the superhero from a gendered perspective. The visualization mainly focuses on 4 parts: names, appearances, figures, and superpowers. It also includes a general overview of these data.
IMA/IMB Shanghai
INTM-SHU.204.1
Critical Data & Visualization
Culture

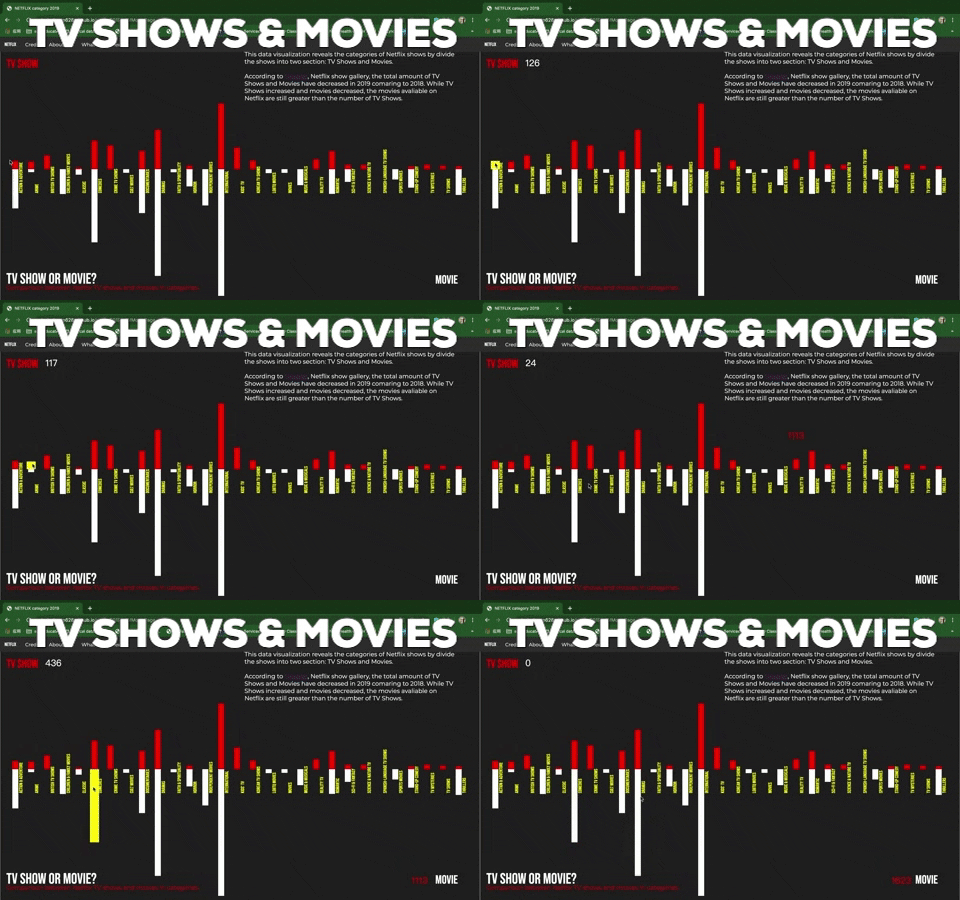
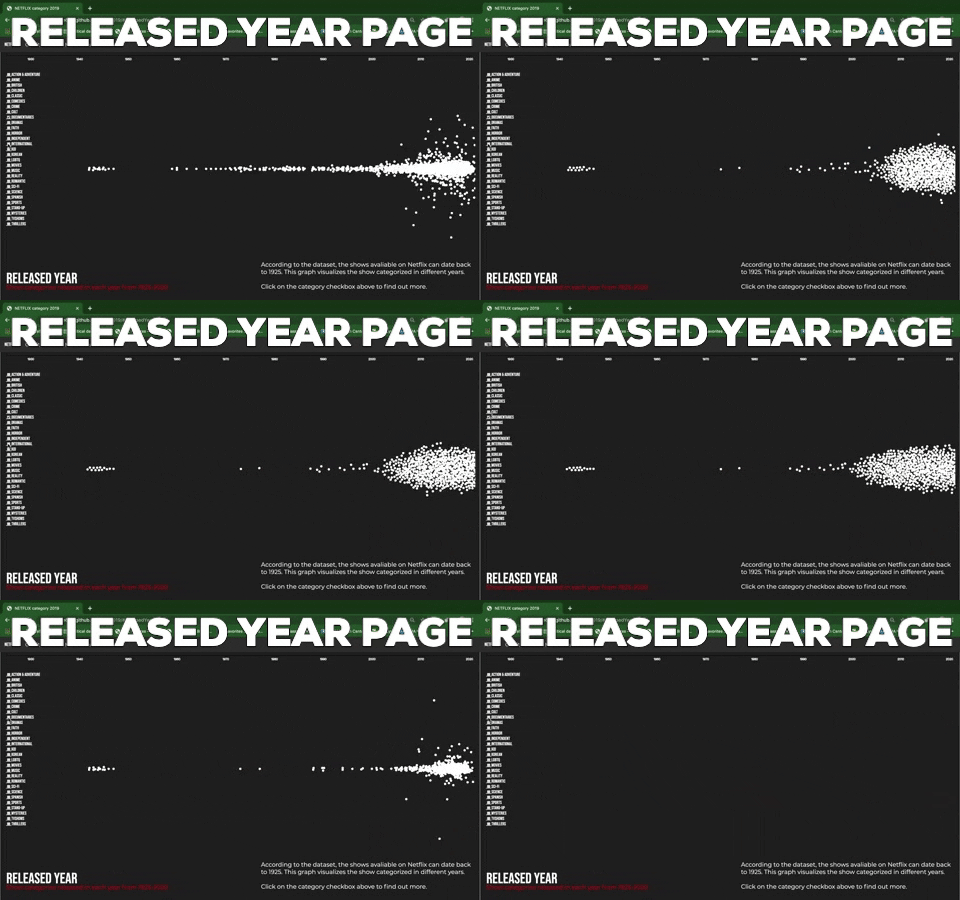
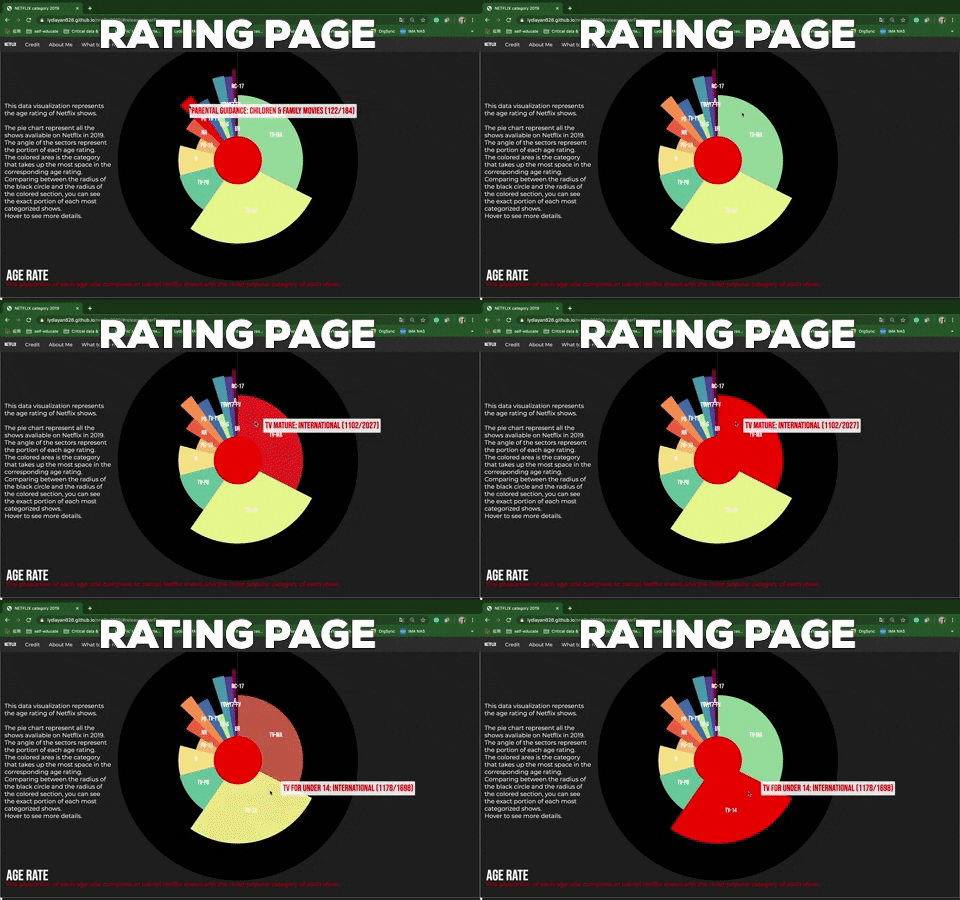
Netflix 2019: What to See Next

The visualization shows the categorized shows on Netflix in 2019

Ziqi Yan

https://youtu.be/peFlhbQDv9U

Description

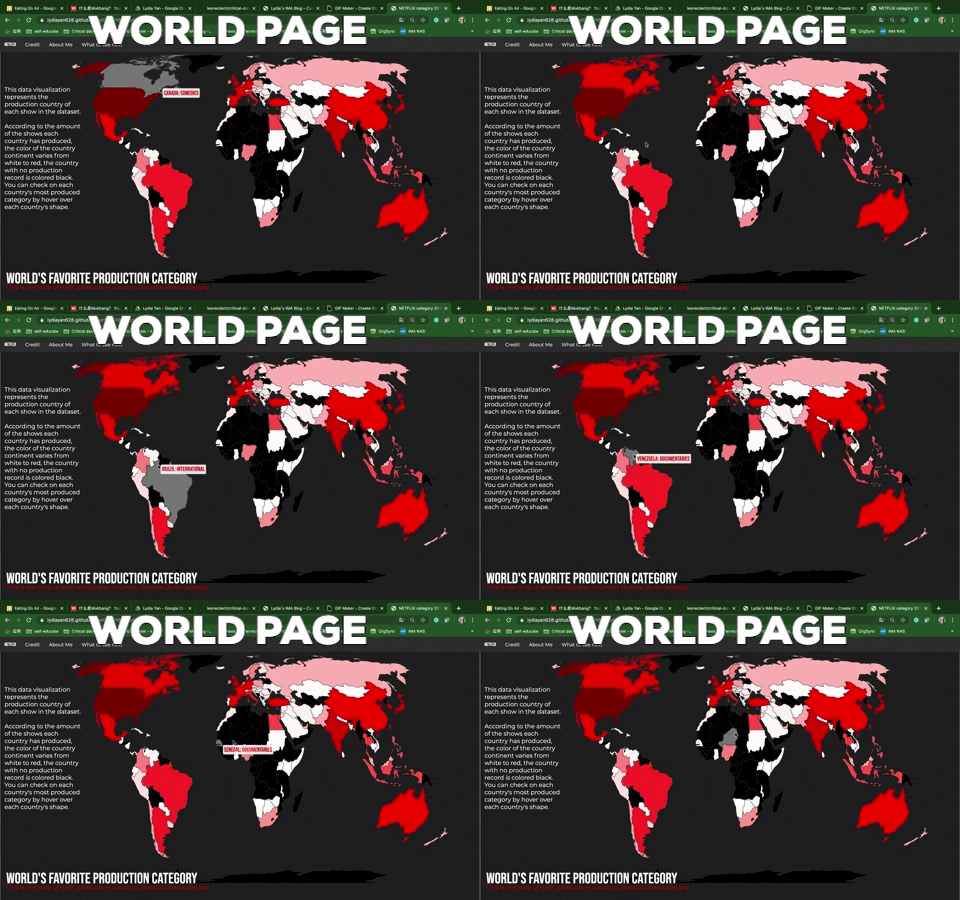
Netflix is a streaming media company that has a huge impact on the world media industry, there are over 167 million subscribers all around the globe which made it the king of streaming. The company is famous for its great contents and it is attracting more and more audiences through its well-established programs.

Netflix is attracting more and more people through its recommendation system which brings up better user experience. As the book Technologies of Vision: The War Between Data and Images by Steve F. Anderson introduces, Netflix aims to take the user viewing history as the database to analyze the aesthetic preferences of its users.

This visualization is to show you what you may see next according to the video category. It will stand on different viewpoints, and show you a simplified function of the recommendation system.

IMA/IMB Shanghai
INTM-SHU.204.1
Critical Data & Visualization
Accessible

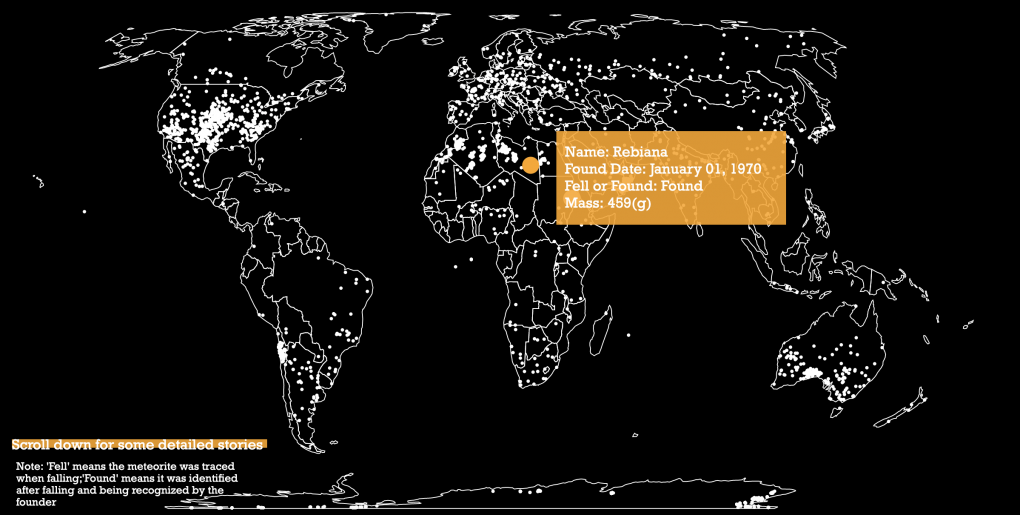
Meteorite Landings

Stories behind the meteorite landings through out history

Chenlan Yao

https://youtu.be/FAUpl6-9umI

Description

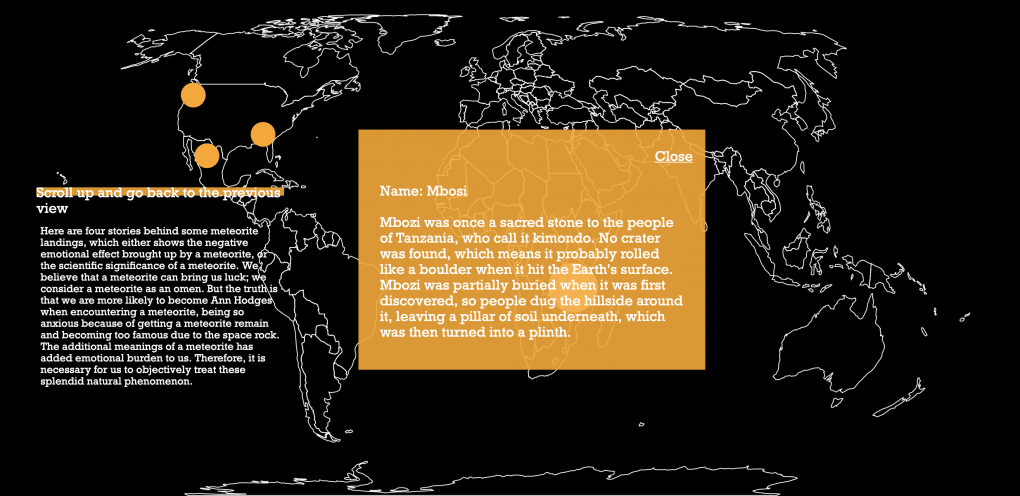
Meteorites are often considered to be mysterious. It takes thousands of years for a meteorite to travel through the space that we do not know much about and come to Earth.

We believe that a meteorite can bring us luck; we consider a meteorite as an omen. But the truth is that we are more likely to become Ann Hodges when encountering a meteorite, being so anxious because of getting a meteorite remain and becoming too famous due to the space rock. The additional meanings of a meteorite have added an emotional burden to us.

This kind of emotional burden caused by meteorites is now being used as a commercial opportunity by some shops. They labeled a rock as a meteorite remain and sell it at a high price, advertising by claiming that the rock can have special power and provide luck and happiness.

At the beginning of this project, I showed the objective process for a meteorite to come into being. Scientifically speaking, there is no evidence that meteorites possess any superhuman powers. I hope that you can know more about the actual formation of a meteorite, be aware of the commercial frauds that might take advantage of your misunderstanding, and appreciate more about the splendid natural phenomenon. They come from billions of years ago; they are the witnesses of the history of the universe.

IMA/IMB Shanghai
INTM-SHU.204.1
Critical Data & Visualization
Culture,Narrative/Storytelling

What We've Lost in Shanghai

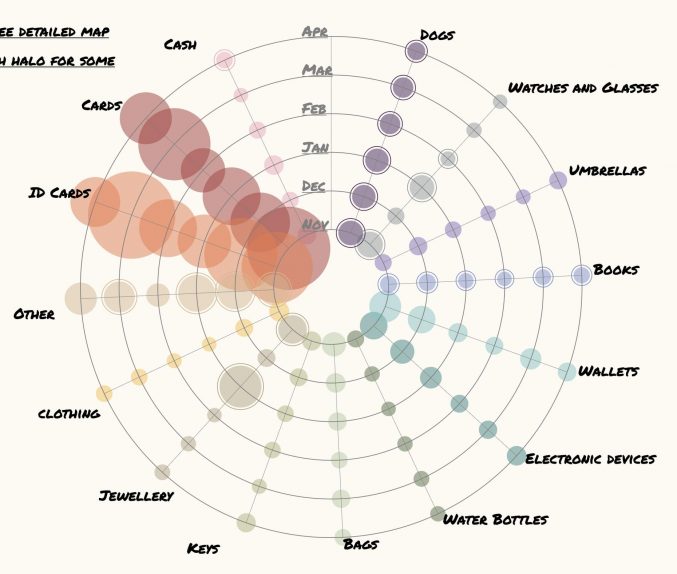
This data visualization project shows where, which and how many lost items people lost in Shanghai over the past half-year.

Tian Qin

https://drive.google.com/file/d/1N1ZLUNHGXOZtSW3nJttbxzXl5AGyr1fX/view?usp=sharing

Description

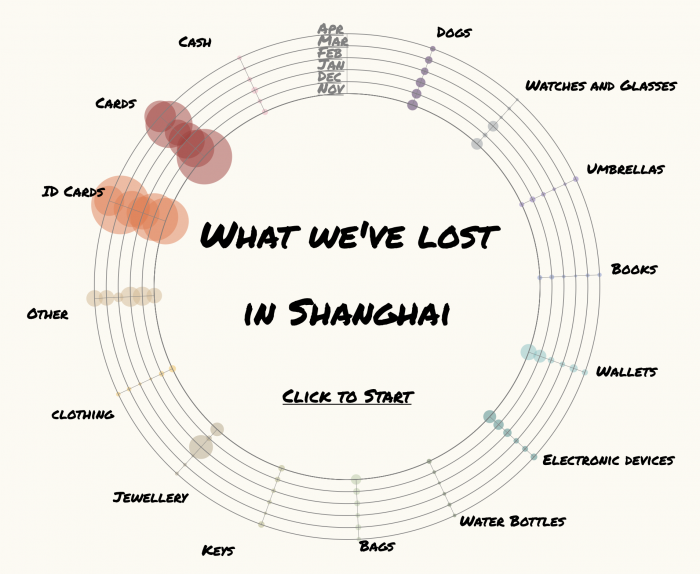
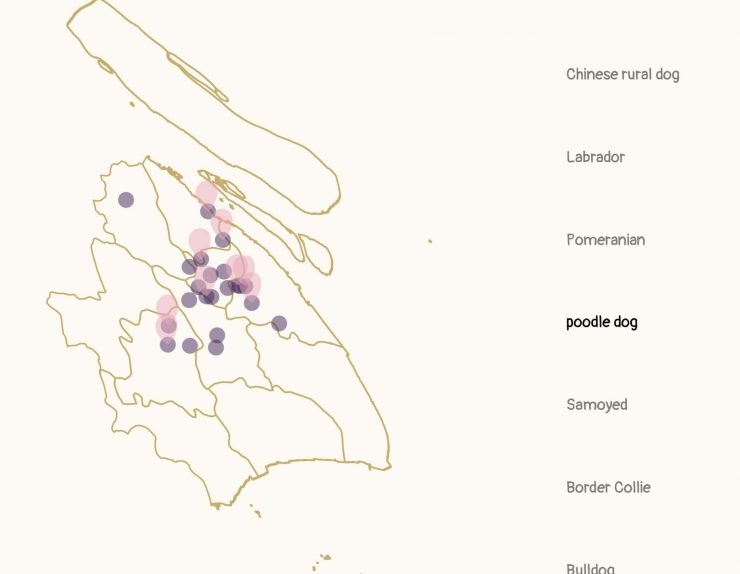
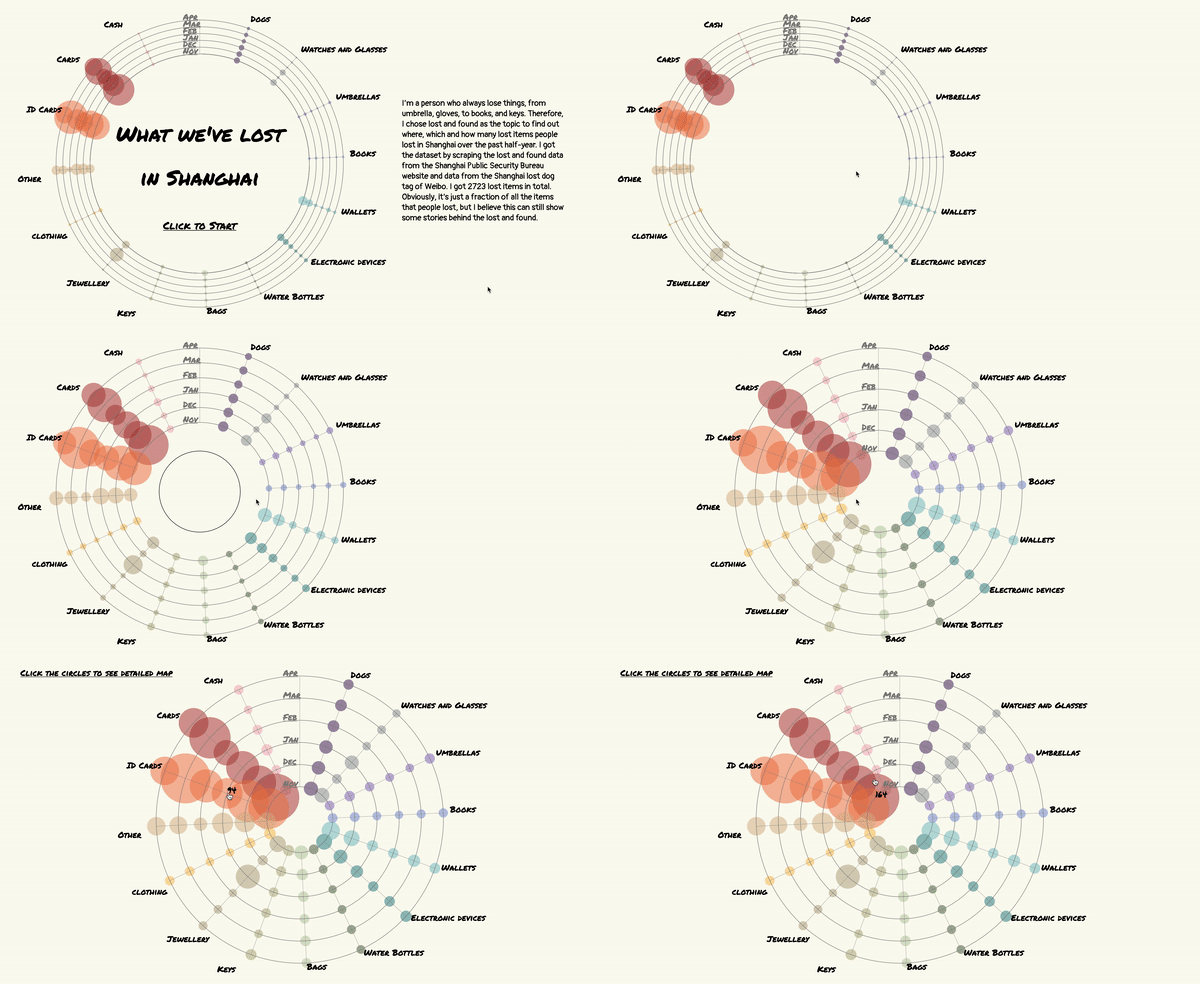
I’m a person who always lose things, from umbrella, gloves, to books, and keys. Therefore, I chose lost and found as the topic to find out where, which and how many lost items people lost in Shanghai over the past half-year. I got the dataset by scraping the lost and found data from the Shanghai Public Security Bureau website and data from the Shanghai lost dog tag of Weibo. I got 2723 lost items in total. Obviously, it’s just a fraction of all the items that people lost, but I believe this can still show some stories behind the lost and found.

IMA/IMB Shanghai
INTM-SHU.204.1
Critical Data & Visualization
Art

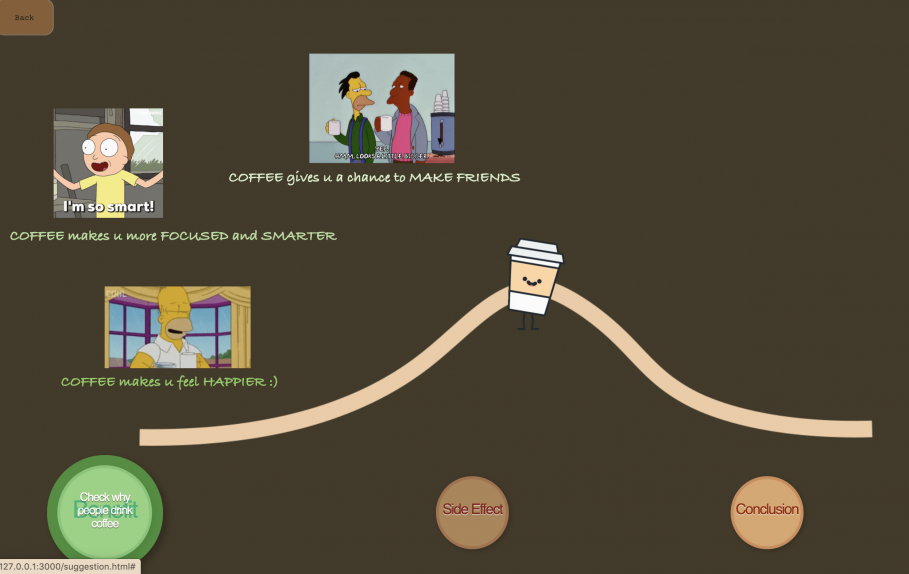
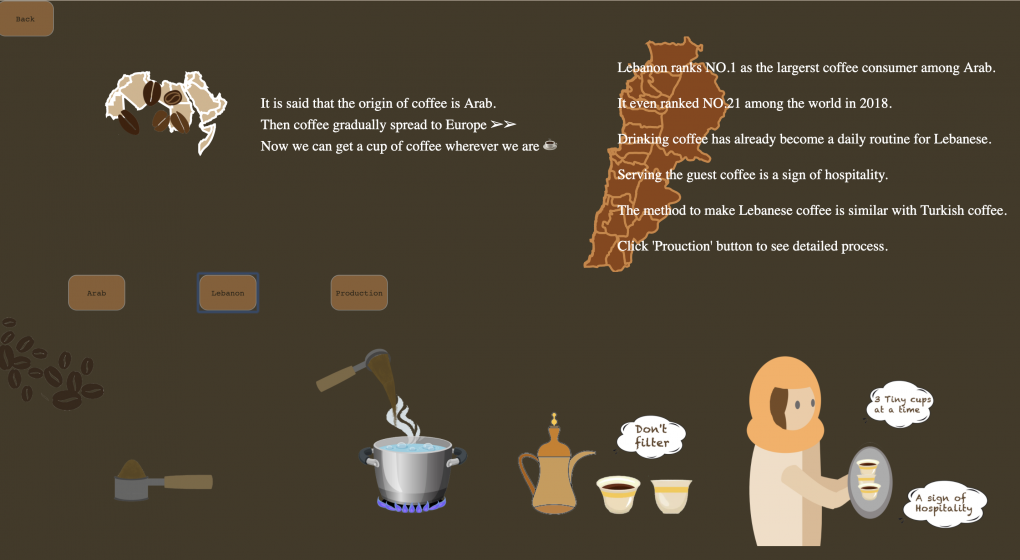
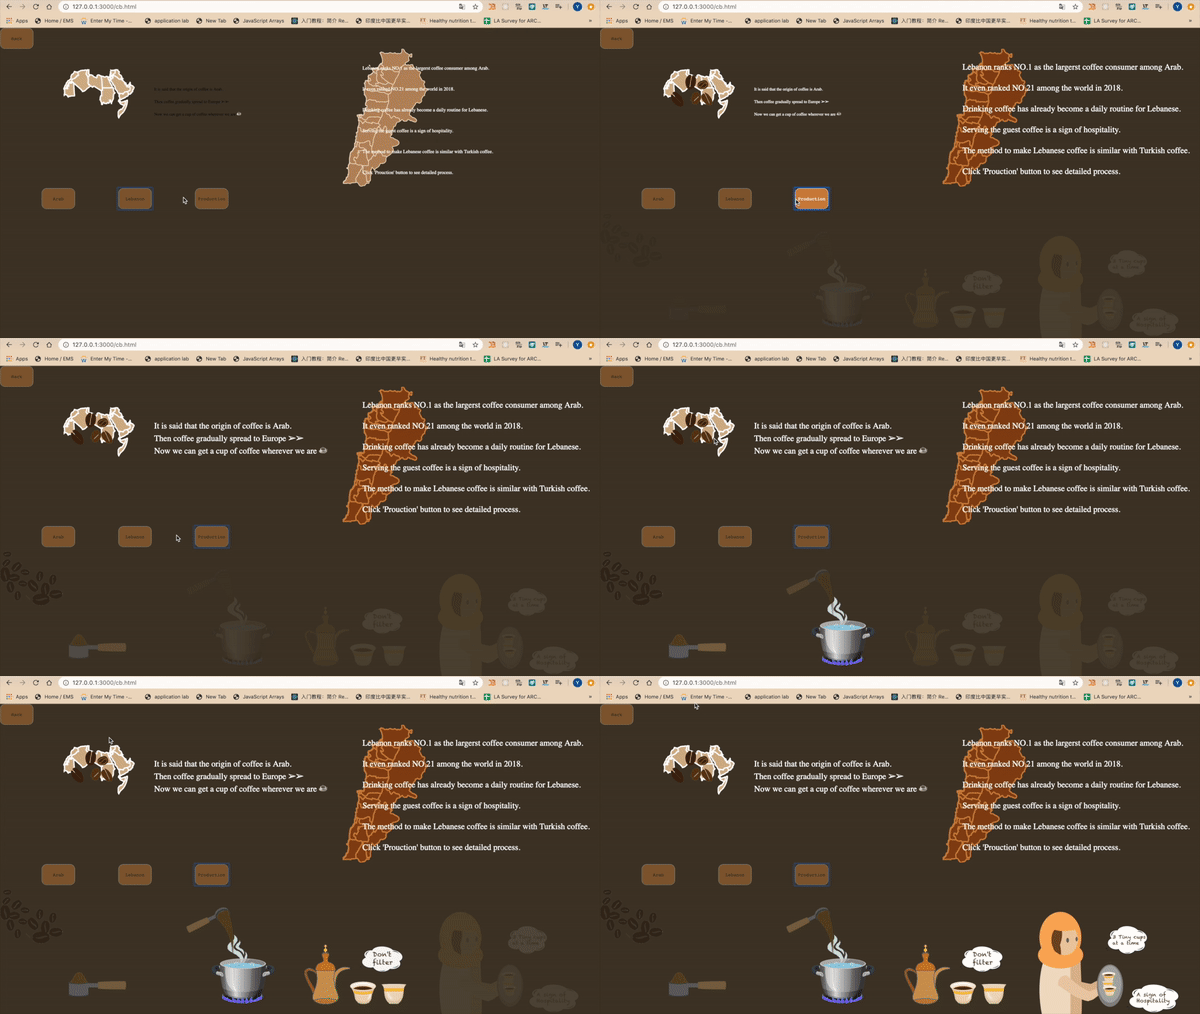
Coffee and Code

Visualization of some fun facts on programmers and their preference on coffee in Lebanon

Yujia Liu

https://youtu.be/00fKlEIyeyE

Description

This project is a visualization of a dataset reflecting 100 Lebanese programmers' preference on when, what kind of and how many cups of coffee they have in a day.

IMA/IMB Shanghai
INTM-SHU.204.1
Critical Data & Visualization
Culture,Art
NYU Tisch School of the Arts provides reasonable accommodations to people with disabilities. Requests for accommodations should be made at least two weeks before the date of the event when possible. You can request accommodations at tisch.nyu.edu/accommodation