Superhero? Not so super on gender

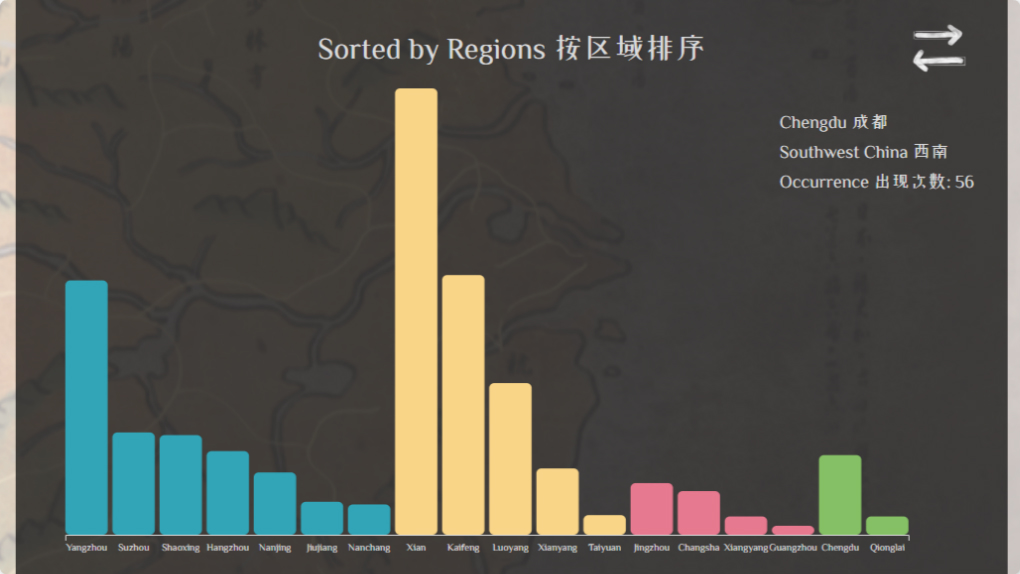
A glimpse into the gender representation of superheroes through data visualization.

Zhinuo Wang

https://vimeo.com/user115539015/review/418787317/728527503c

Description

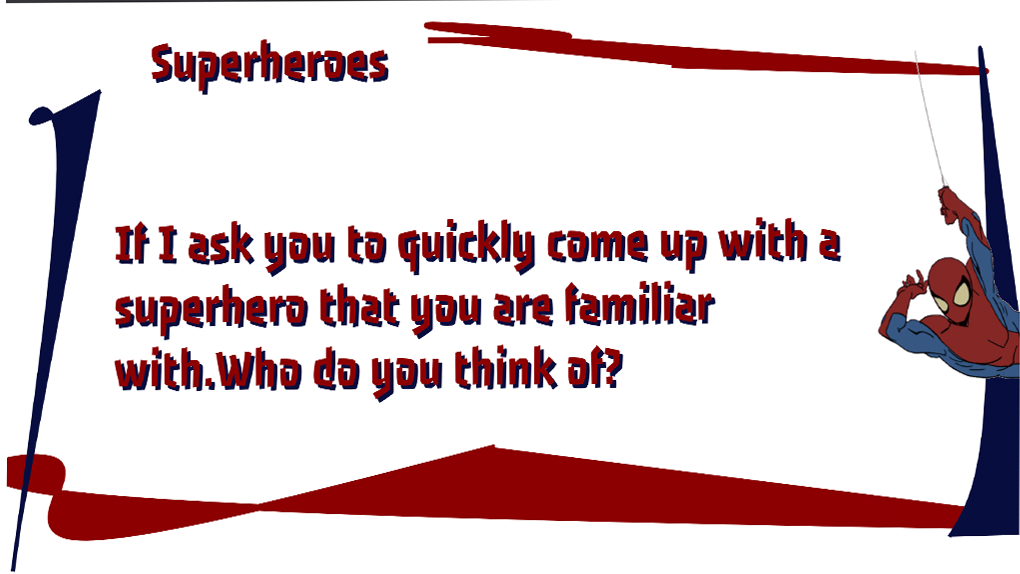
Being one of the mainstream cultures, the superhero has gained its global popularity. Along with its great popularity comes its huge influence, the superhero has become the model in both kids' and adults’ hearts. However, being a creation in the 19th century, there is a lack of diverse gender representation of the superheroes. By looking into more than 700 data points, this project aims at providing an insight into the superhero from a gendered perspective. The visualization mainly focuses on 4 parts: names, appearances, figures, and superpowers. It also includes a general overview of these data.
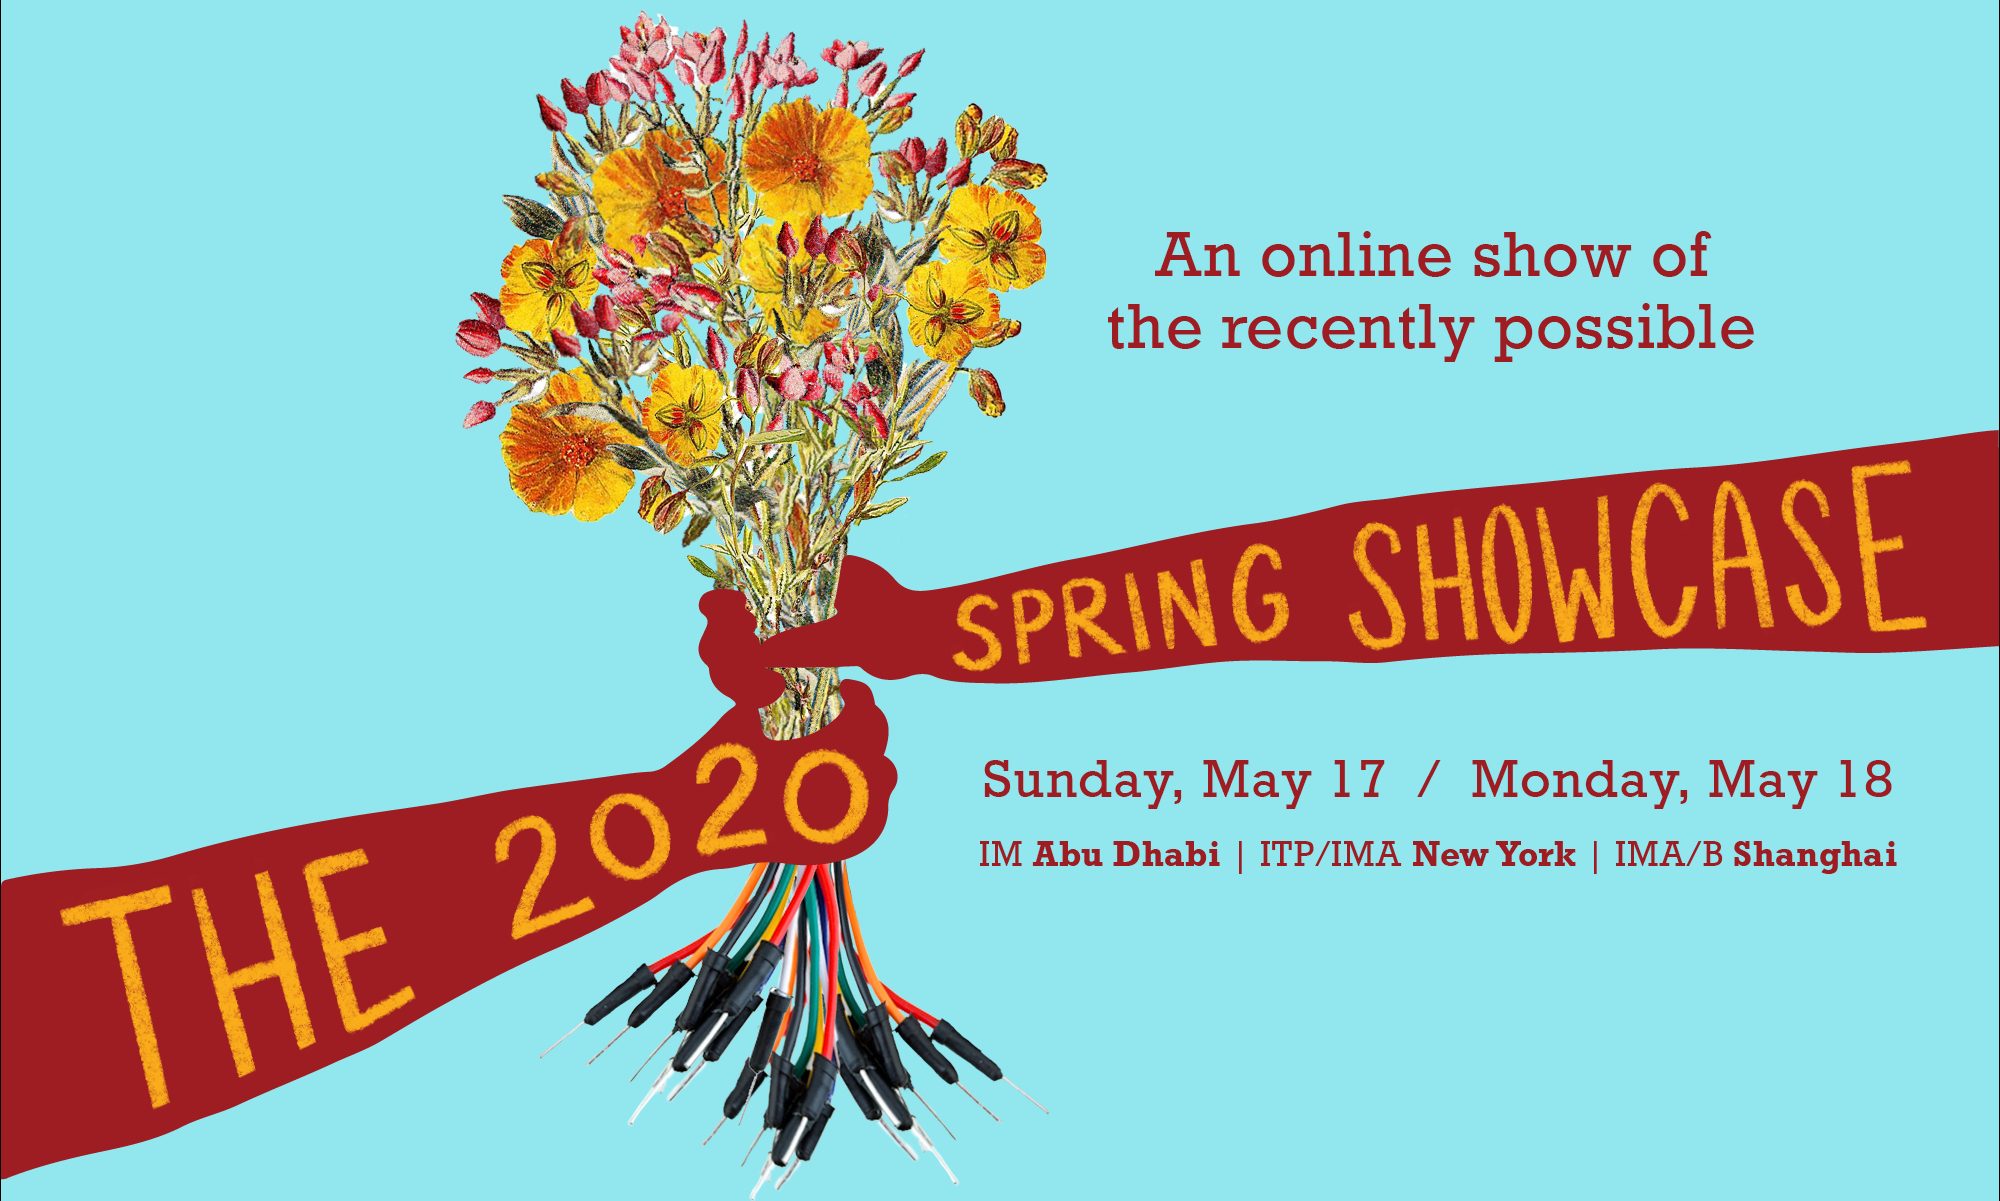
IMA/IMB Shanghai
INTM-SHU.204.1
Critical Data & Visualization
Culture

Netflix 2019: What to See Next

The visualization shows the categorized shows on Netflix in 2019

Ziqi Yan

https://youtu.be/peFlhbQDv9U

Description

Netflix is a streaming media company that has a huge impact on the world media industry, there are over 167 million subscribers all around the globe which made it the king of streaming. The company is famous for its great contents and it is attracting more and more audiences through its well-established programs.

Netflix is attracting more and more people through its recommendation system which brings up better user experience. As the book Technologies of Vision: The War Between Data and Images by Steve F. Anderson introduces, Netflix aims to take the user viewing history as the database to analyze the aesthetic preferences of its users.

This visualization is to show you what you may see next according to the video category. It will stand on different viewpoints, and show you a simplified function of the recommendation system.

IMA/IMB Shanghai
INTM-SHU.204.1
Critical Data & Visualization
Accessible

Interactive Senior Year

COVID-19 destroyed all chances of my sister having a normal senior year filled with traditions.

Sarah Armstrong

https://youtu.be/N85NxgzF-4o

Description

The subject I chose to portray is my sister’s second semester of senior year with a twist. As of now, she is stuck inside unable to participate in the traditions that come with senior year of high school coming to an end. American high schools have senior (last year) traditions that begin the second semester of senior year because only the first half of the year grades will be sent to colleges when they are looking to accept you. Therefore, as long as you do not fail out of high school, these second-semester grades do not count against you. The traditions my sister will be missing out on include, but are not limited to her senior prank, senior skip day, college shirt day, senior banquet, prom, and looking to be graduation. I also think this is a unique subject because this will be a way to honor my sister who is really disappointed she will not be able to do these things.

IMA/IMB Shanghai
INTM-SHU.120.7
Communications Lab
Narrative/Storytelling

Meteorite Landings

Stories behind the meteorite landings through out history

Chenlan Yao

https://youtu.be/FAUpl6-9umI

Description

Meteorites are often considered to be mysterious. It takes thousands of years for a meteorite to travel through the space that we do not know much about and come to Earth.

We believe that a meteorite can bring us luck; we consider a meteorite as an omen. But the truth is that we are more likely to become Ann Hodges when encountering a meteorite, being so anxious because of getting a meteorite remain and becoming too famous due to the space rock. The additional meanings of a meteorite have added an emotional burden to us.

This kind of emotional burden caused by meteorites is now being used as a commercial opportunity by some shops. They labeled a rock as a meteorite remain and sell it at a high price, advertising by claiming that the rock can have special power and provide luck and happiness.

At the beginning of this project, I showed the objective process for a meteorite to come into being. Scientifically speaking, there is no evidence that meteorites possess any superhuman powers. I hope that you can know more about the actual formation of a meteorite, be aware of the commercial frauds that might take advantage of your misunderstanding, and appreciate more about the splendid natural phenomenon. They come from billions of years ago; they are the witnesses of the history of the universe.

IMA/IMB Shanghai
INTM-SHU.204.1
Critical Data & Visualization
Culture,Narrative/Storytelling

What We've Lost in Shanghai

This data visualization project shows where, which and how many lost items people lost in Shanghai over the past half-year.

Tian Qin

https://drive.google.com/file/d/1N1ZLUNHGXOZtSW3nJttbxzXl5AGyr1fX/view?usp=sharing

Description

I’m a person who always lose things, from umbrella, gloves, to books, and keys. Therefore, I chose lost and found as the topic to find out where, which and how many lost items people lost in Shanghai over the past half-year. I got the dataset by scraping the lost and found data from the Shanghai Public Security Bureau website and data from the Shanghai lost dog tag of Weibo. I got 2723 lost items in total. Obviously, it’s just a fraction of all the items that people lost, but I believe this can still show some stories behind the lost and found.

IMA/IMB Shanghai
INTM-SHU.204.1
Critical Data & Visualization
Art

Coffee and Code

Visualization of some fun facts on programmers and their preference on coffee in Lebanon

Yujia Liu

https://youtu.be/00fKlEIyeyE

Description

This project is a visualization of a dataset reflecting 100 Lebanese programmers' preference on when, what kind of and how many cups of coffee they have in a day.

IMA/IMB Shanghai
INTM-SHU.204.1
Critical Data & Visualization
Culture,Art

Spying The Moon

This project visualizes the TR R-277 report, also know as Nasa’s Chronological Catalog of Reported Lunar Events, and try to interpret this dataset with its historic background the “Space War”.

Lishan Qin

https://lq455.github.io./

Description

The dataset I visualize is Nasa’s Chronological Catalog of Reported Lunar Events released in 1968, also known as the TR R-277 report. It was at that time the single most complete report of all observed lunar anomalies. It lists 536 pieces of records from 1500 till 1967 that include the date, the location, and the description of the reported abnormal lunar event observed from the earth. From the dataset, I can see a significant rise in the number of records after the Cold War began, the time when the historic event “Space Race” took place. Through the visualization of this report, my project intends to highlight the rise of the number of records during the Cold War to show the United States’ devotion to the “Space Race” and potentially their paranoia about being outdone in the race to the moon during the Cold War. While the TR R-277 may seem like an insignificant aspect of the US’s efforts in the “Space Race”, it is still a rather important project. By recording the Nasa’s observation of the abnormal events happening on the moon, it had helped the NASA to understand the moon, observe what they and their enemy are doing on the moon, and also to imagine what they and their enemy could do on the moon. After researching about the context and history of this data, I think that this dataset can show us three possible historic features. Firstly, the founding of NASA gradually contributes to the number of people devoted to the observation of the activity on the moon, which made the number of records at that time increase. Secondly, the tension of the race to the moon during the cold war had led to more research satellites sent to the moon which not only made the detected range on the moon wider but also made the number of detected activities increase. Thirdly, America's paranoia about the activities on the moon for fear of being surpassed in the space war has made their observation more careful and thorough. Thus, in my opinion, this dataset could reflect America’s devotion and passion about the moon during the time of the “Space Race”.

IMA/IMB Shanghai
INTM-SHU.204.1
Critical Data & Visualization
Narrative/Storytelling

Emojified Social Media

A research that processes English tweets with emojis and a data visualization on the use of Emojis on twitter, with regard to Sentiment, Spam, Combination & Position.

Chengyu Zhang

https://mstxy.github.io/Emojified-Social-Media/

Description

The project is based on a raw dataset of 18 million unprocessed English tweets with at least one emojis, as well as a file about the how these emojis are used in Twitter: how many are used in positive, neutral and negative tweets.

  For the analyze of the data, I calculated the sentiment score for each emoji – if it is used more in negative tweets, then it is more negative than positive. Then, using Python's VADER and NLTK library, I get the text sentiment for each tweet. Other than that, I processed the data to get the average Position of each emoji, Combinations of emojis in each text, the number of times one emoji is Spammed in each text.

  Therefore, for the project, it is a visualization of my result of the research mainly using d3.js library. It includes five different interactive graphs, each represents one aspect of my result.

  Hope you enjoy it!

IMA/IMB Shanghai
INTM-SHU.204.1
Critical Data & Visualization
Narrative/Storytelling

Map of Songci 宋词地图

An interactive map project connecting cities in China with Chinese poetry.

Sumner Feng

https://youtu.be/xk7pPF5Os8k

Description

The map of Songci is a web-based interactive map project. The project focuses on the cities appeared in Songci and picks out representative ones to make visualizations. As for interactive functions, this project includes diverse sound, art, and story elements. Aiming at providing an interactive experience for users to pursue a better understanding of this poetry style associated with the history of the Song Dynasty, this project will connect the historical information of cities to the map of Song to introduce diverse aspects and stories of Song Ci and the Song Dynasty.

(The loading of the music could take a while, please wait until the music starts and then begin exploring.)

IMA/IMB Shanghai
INTM-SHU.204.1
Critical Data & Visualization
Culture,Art