Introduction
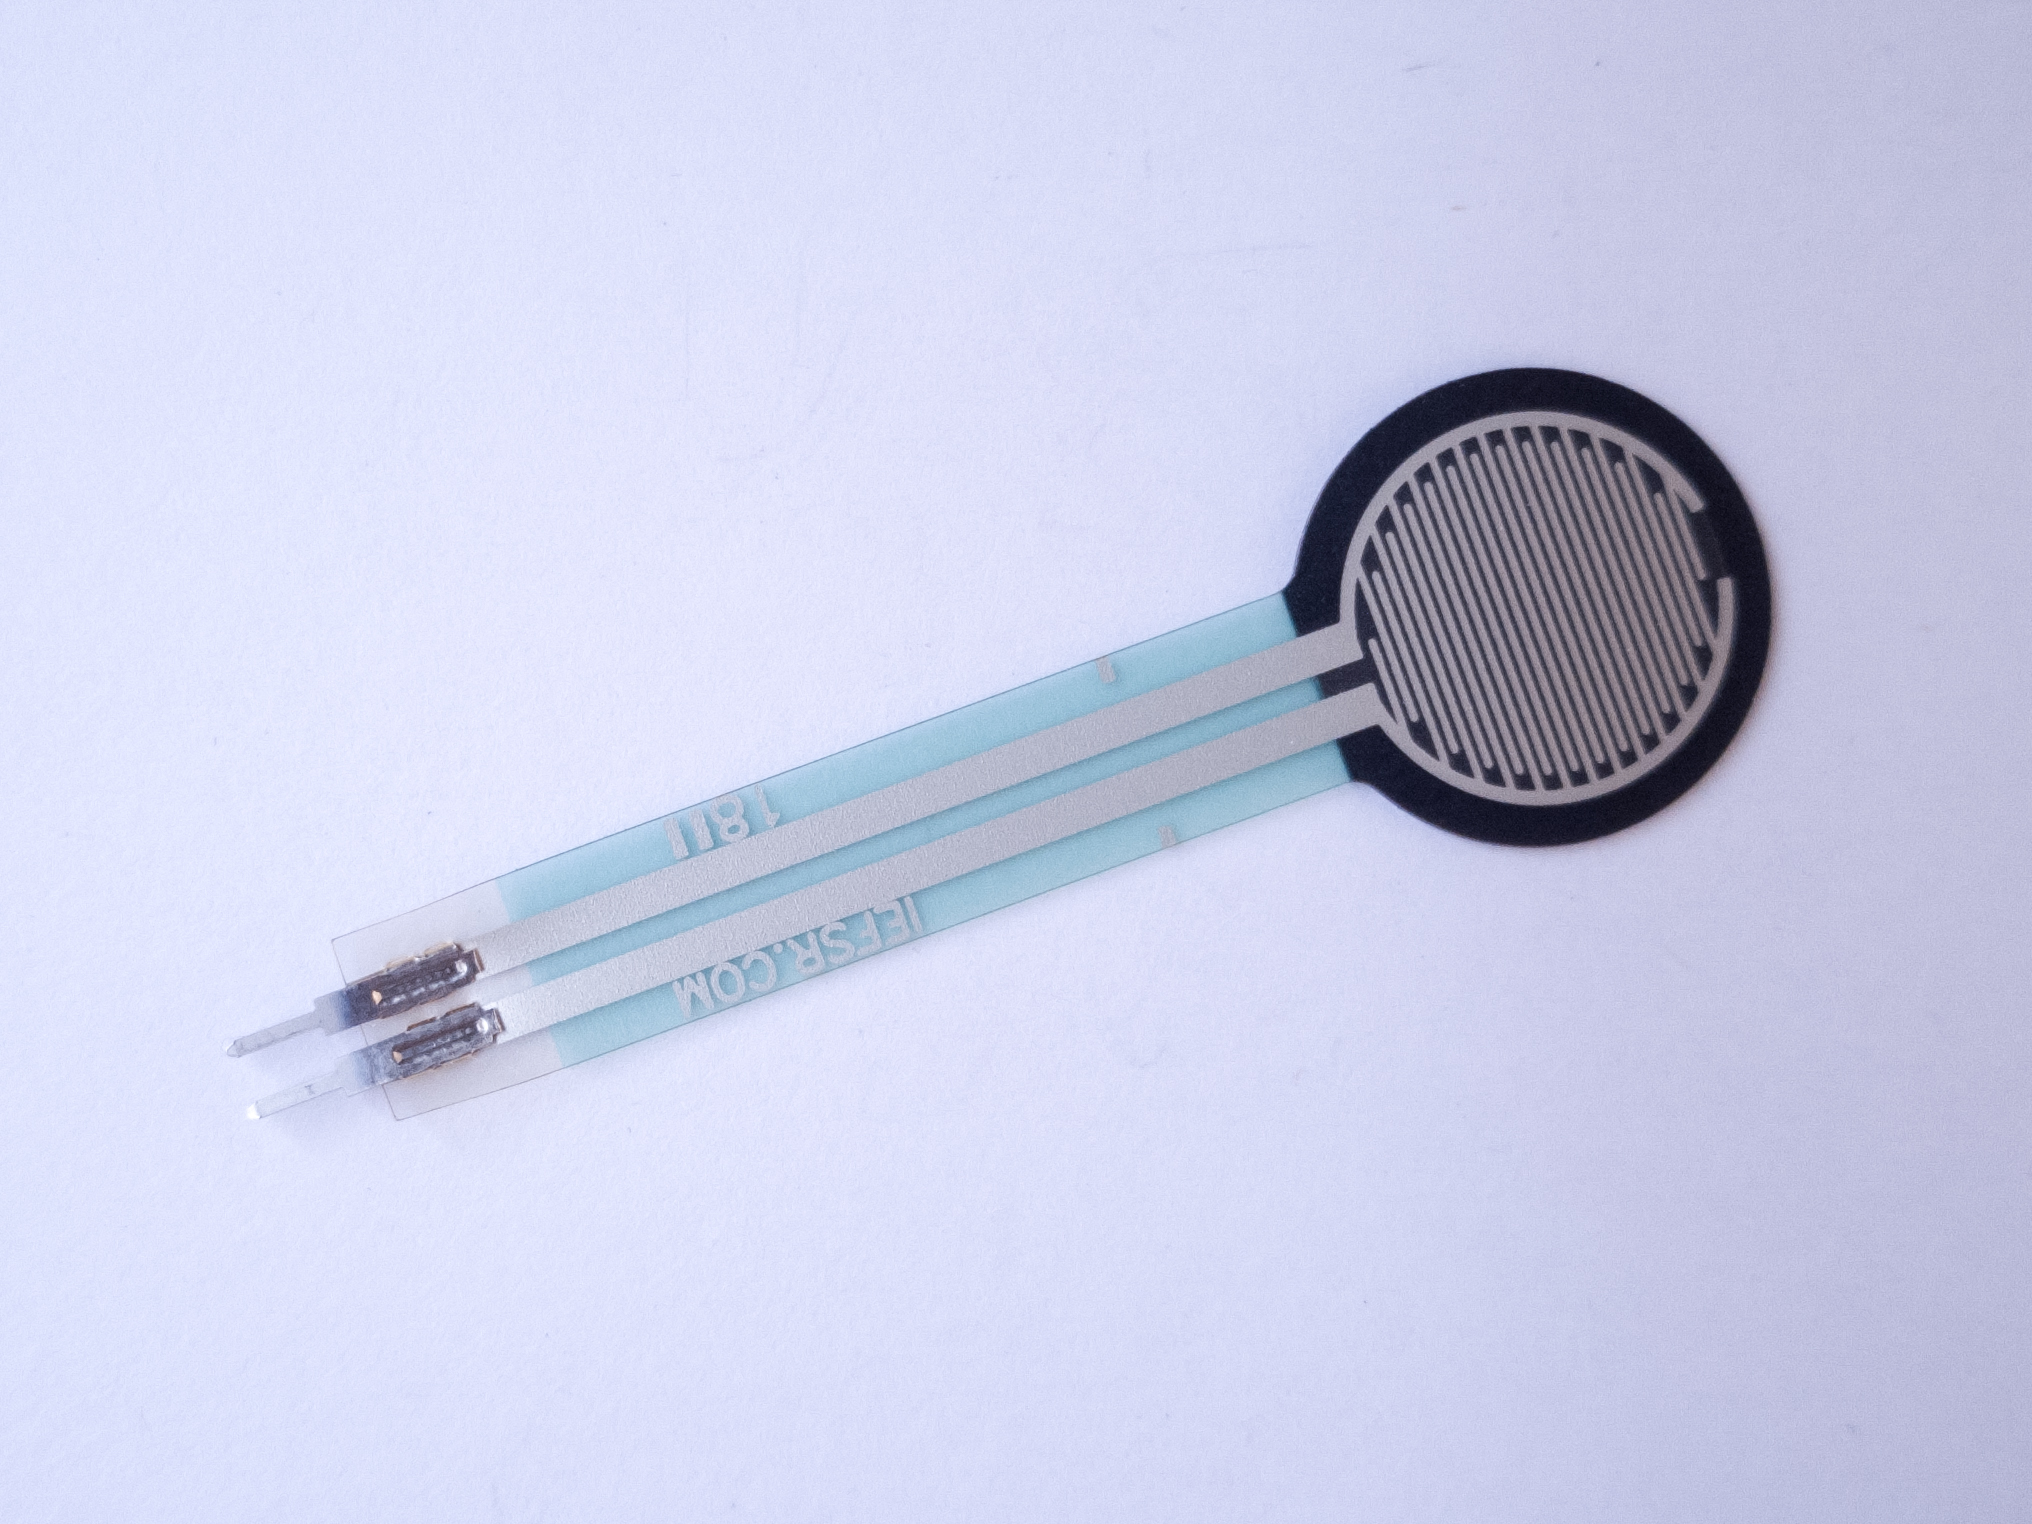
Microcontrollers can sense what’s going on in the physical world using digital and analog sensors, but a single sensor reading doesn’t tell you much. In order to tell when something significant happens, you need to know when that reading changes. For example, when a digital input changes from LOW to HIGH or the reverse, you can tell that a person closed or opened a switch. When a force-sensing resistor reaches a peak reading, you know that something has hit the sensor. In this lab, you’ll learn how to program your microcontroller to look for three common changes in sensor readings that give you information about events in the physical world: state change detection on digital sensors, and threshold crossing and peak detection on analog sensors. You’ll use these three techniques all the time when you’re designing to read users’ actions.
What You’ll Need to Know
To get the most out of this lab, you should be familiar with the following concepts. You can check how to do so in the links below:
- Digital Input with Arduino
- Analog Input with Arduino
- Basic microcontroller programming concepts, including variables and conditional statements.
Things You’ll Need
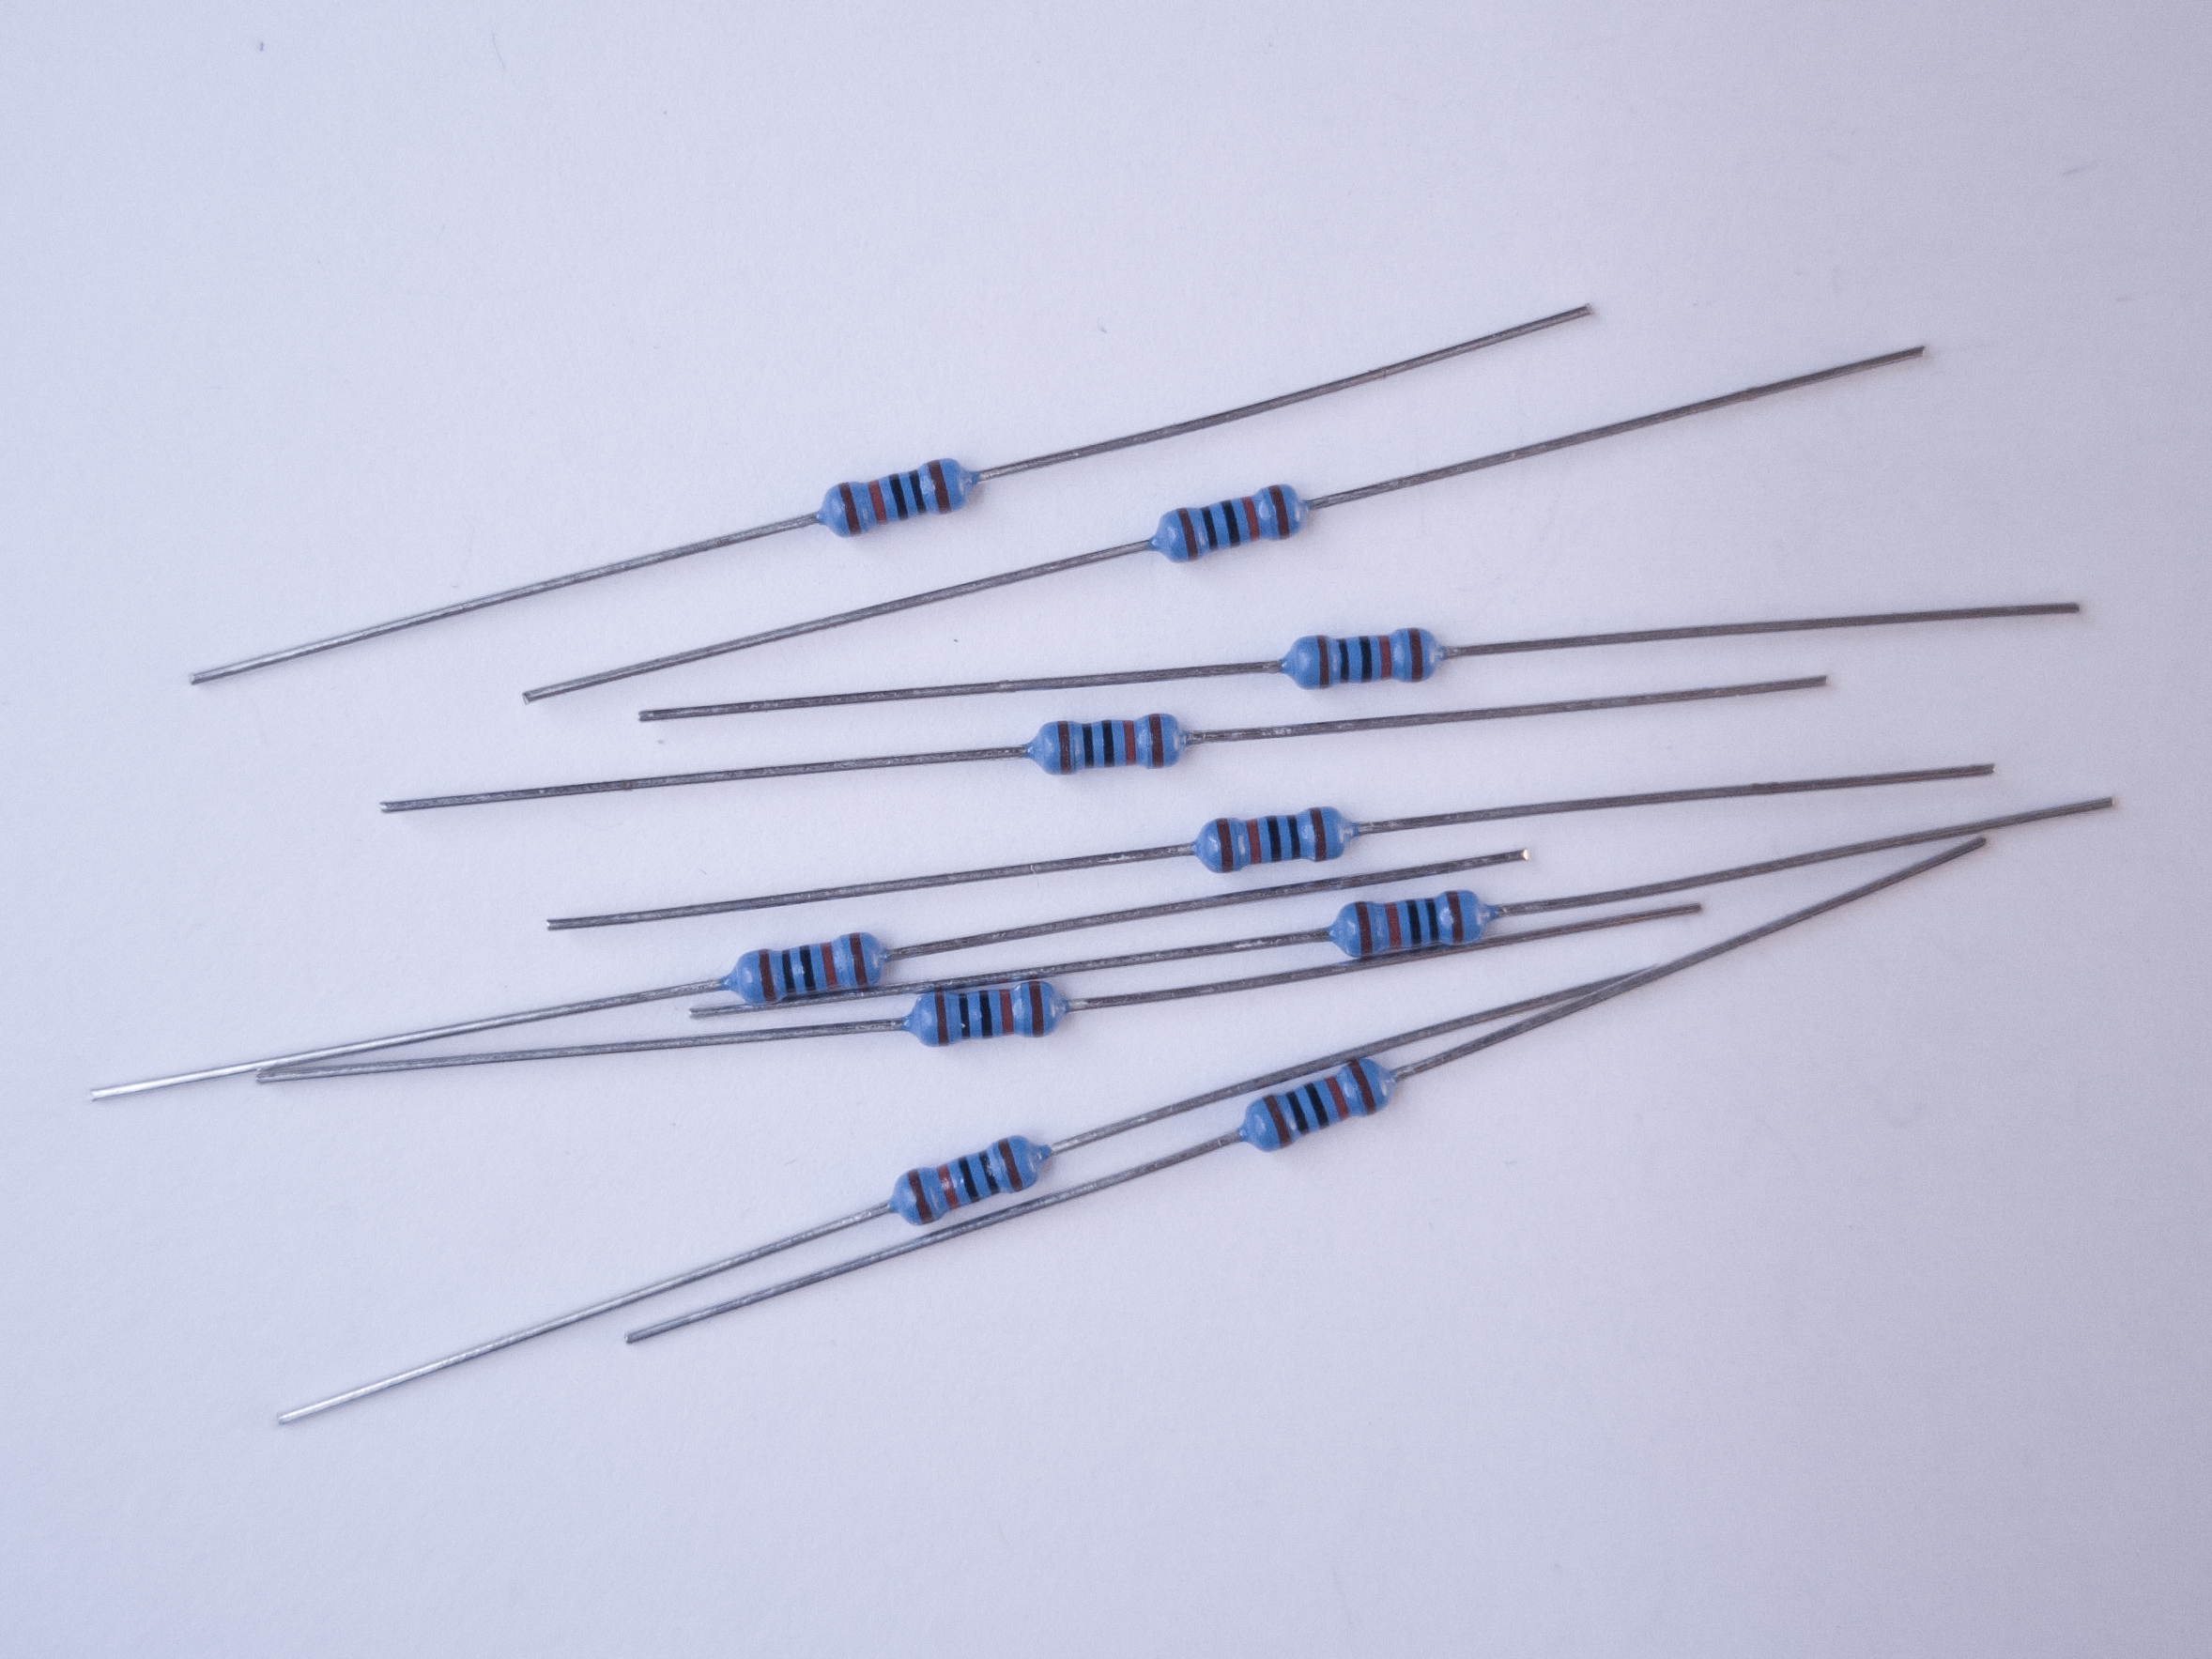
Understanding How Your Sensor Changes
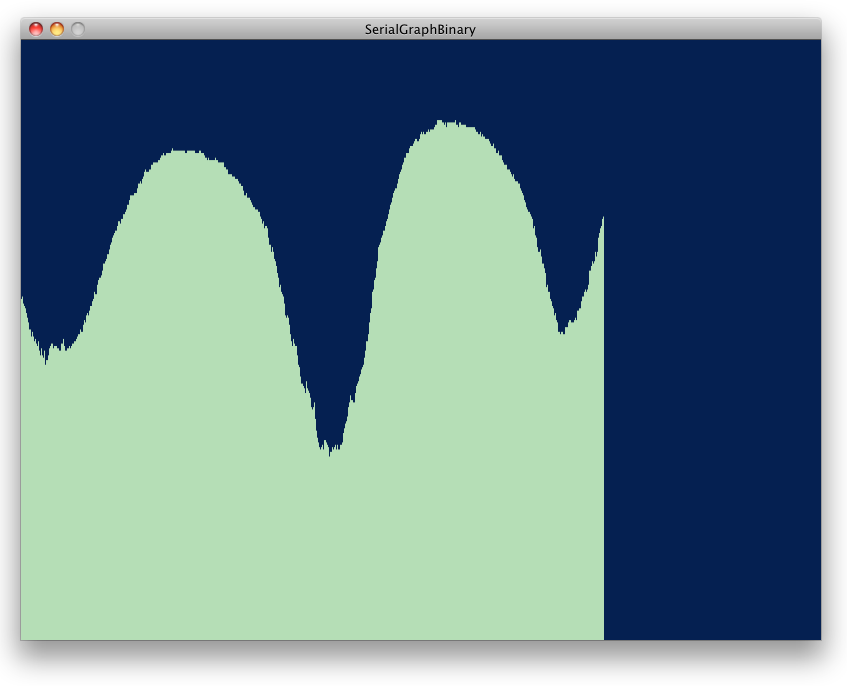
Before you start trying to detect specific sensor change events, you should know what your sensor’s changes look like over time. You might want to start by viewing the change on an oscilloscope, or by using the Serial Plotter in the Arduino IDE Tools menu (command-shift-L), or a graphing program like the one shown in the WebSerial input to p5.js Lab or Serial Output From Arduino to Processing lab to understand how your sensors change. Figure 7 shows a typical sensor change graph.
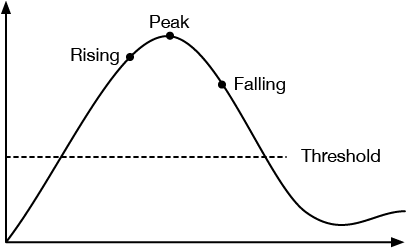
Sensor changes are described in terms of the change in the sensor’s property, often a voltage output, over time. The most important cases to consider for sensor change are the rising and falling edges of a digital or binary sensor, and the rising and falling edges and the peak of an analog sensor. The graphs in Figures 8 and 9 of sensor voltage over time illustrate these conditions:

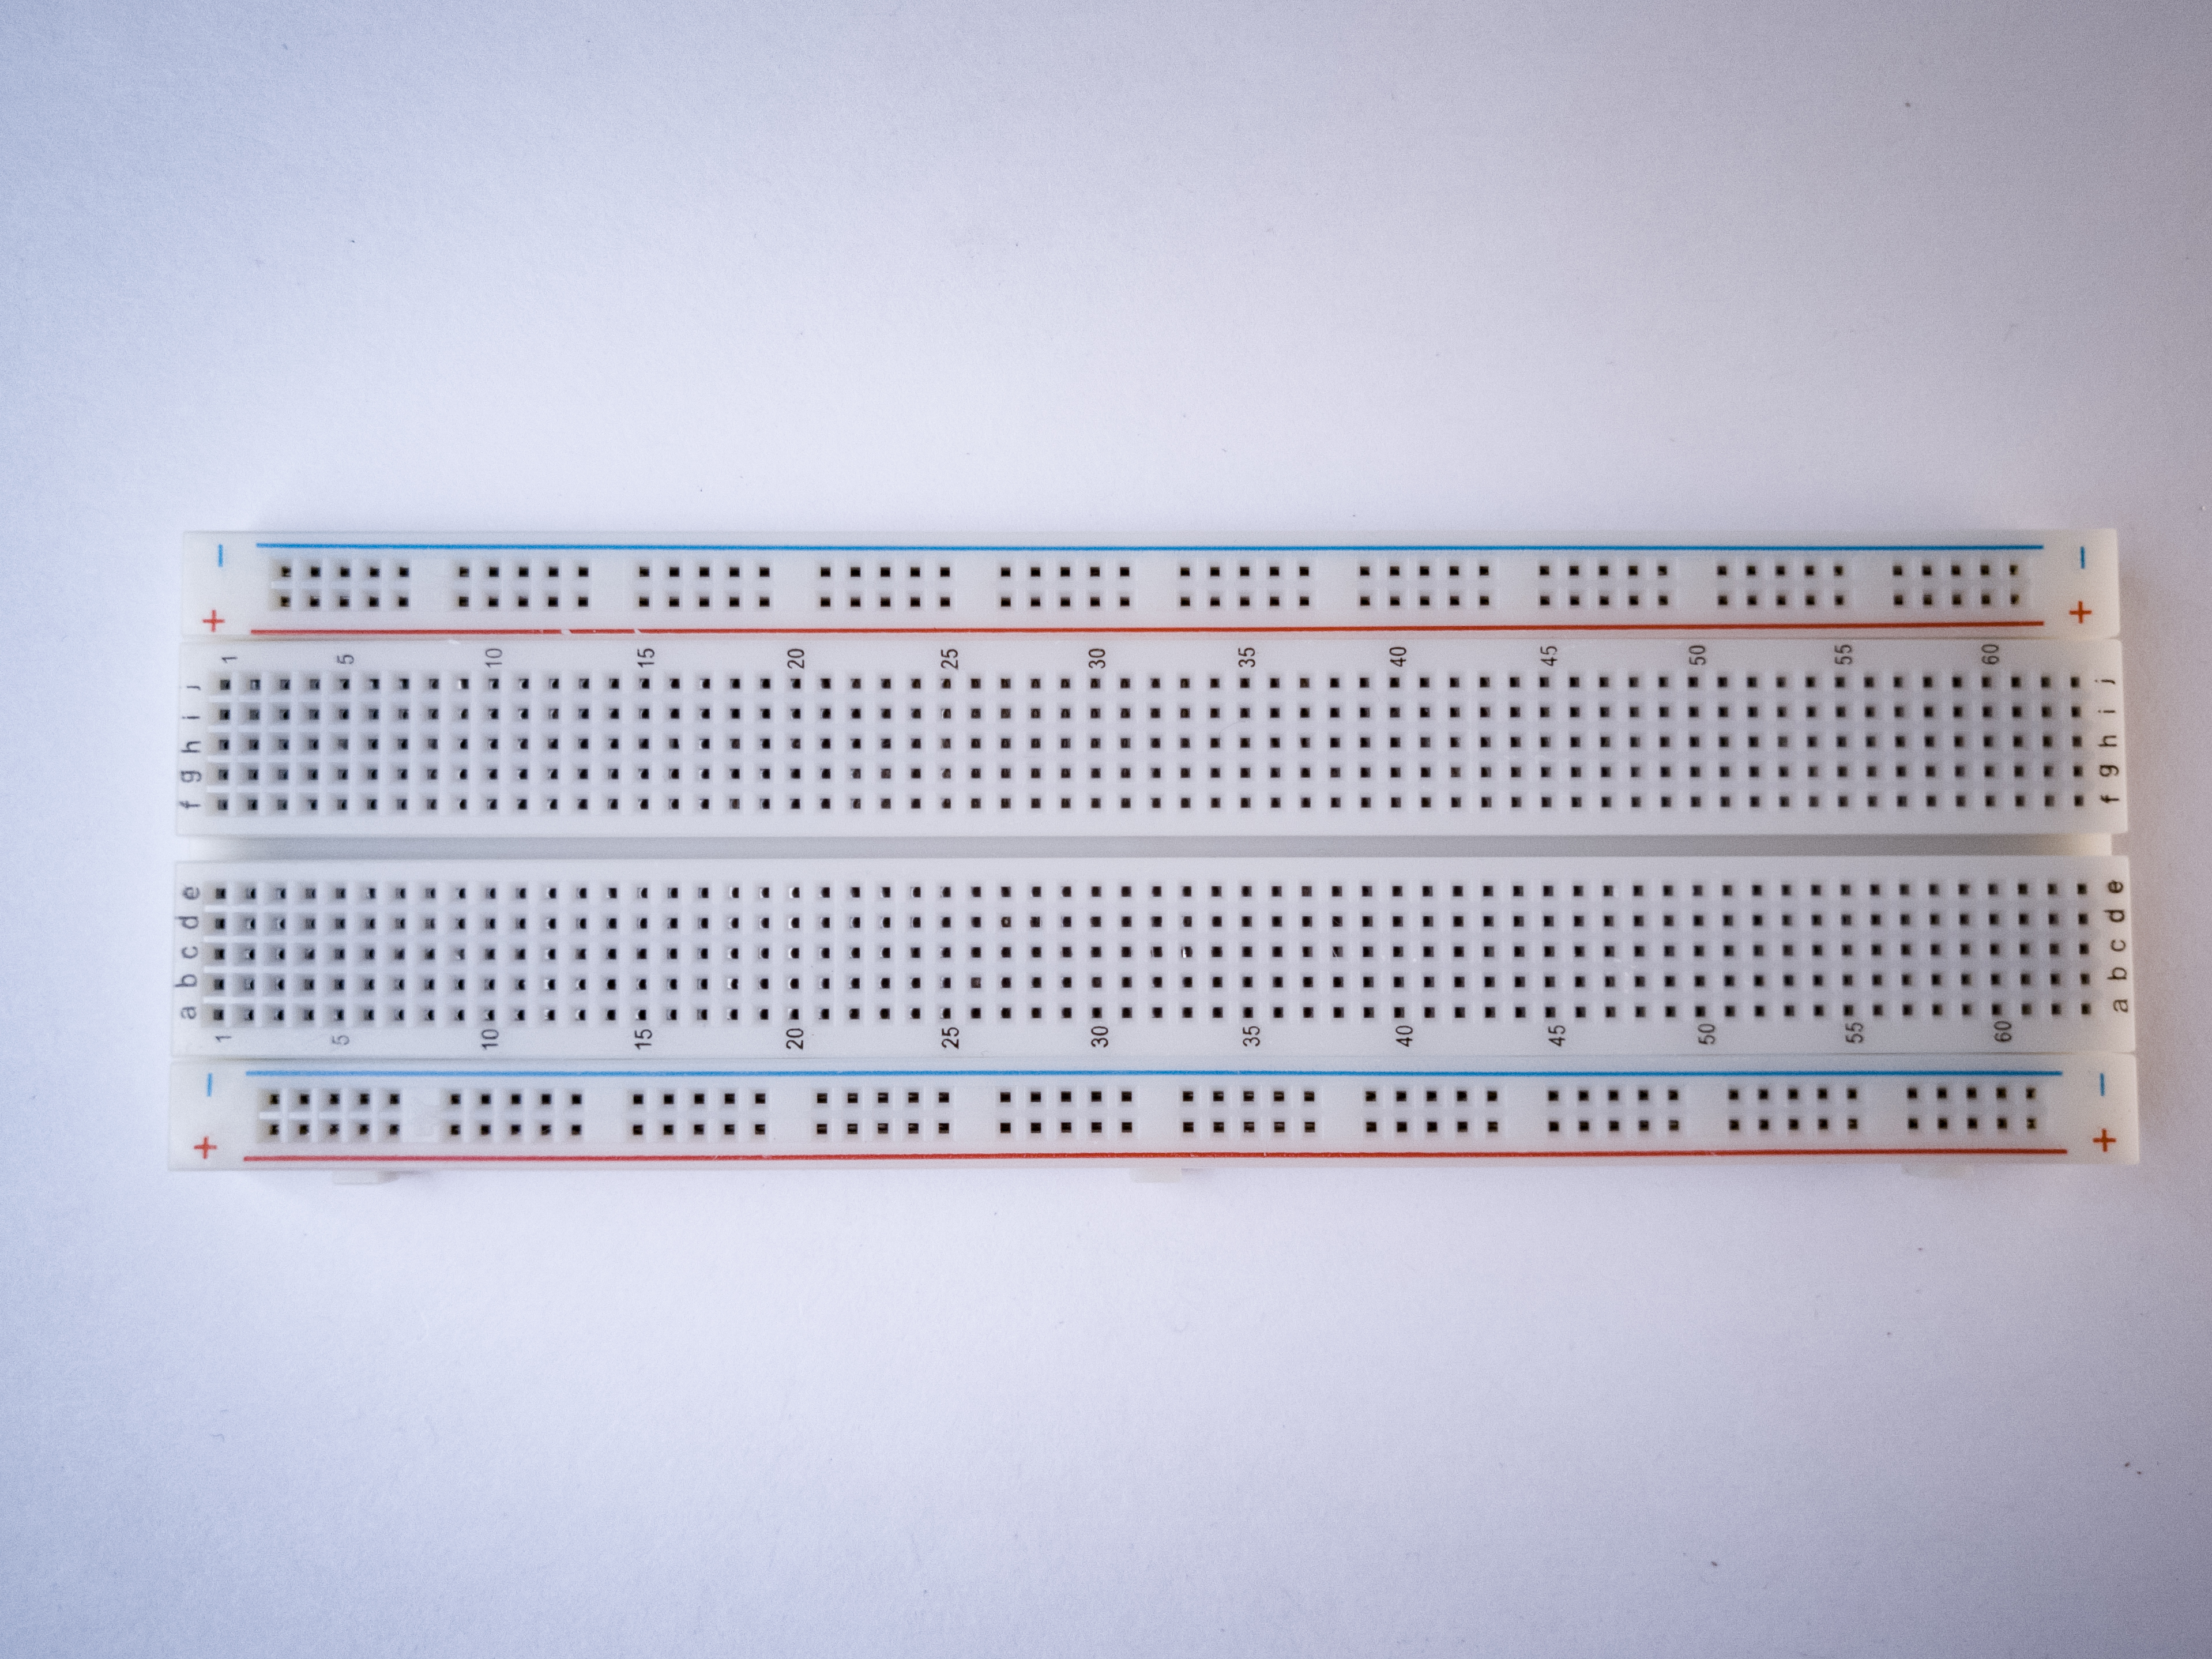
Prepare the breadboard
Connect power and ground on the breadboard to power and ground from the microcontroller. On the Arduino module, use the 5V or 3.3V (depending on your model) and any of the ground connections, as shown in Figures 10 and 11.
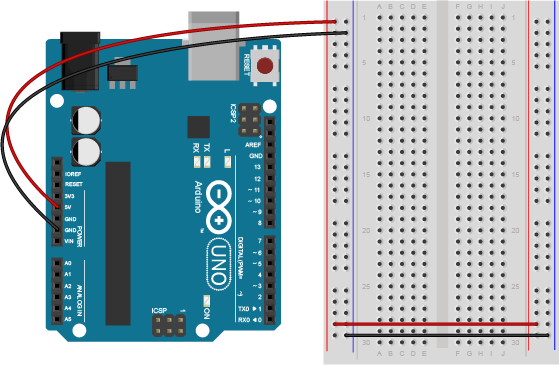
Figure 10 shows an Arduino Uno on the left connected to a solderless breadboard, right. The Uno’s 5V output hole is connected to the red column of holes on the far left side of the breadboard. The Uno’s ground hole is connected to the blue column on the left of the board. The red and blue columns on the left of the breadboard are connected to the red and blue columns on the right side of the breadboard with red and black wires, respectively. These columns on the side of a breadboard are commonly called the buses. The red line is the voltage bus, and the black or blue line is the ground bus.
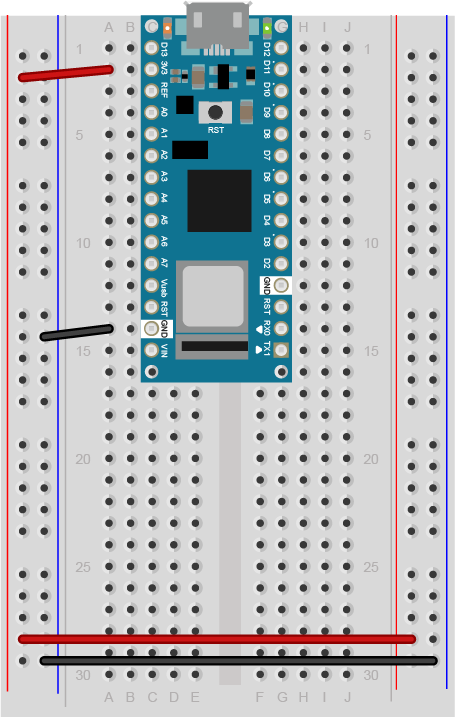
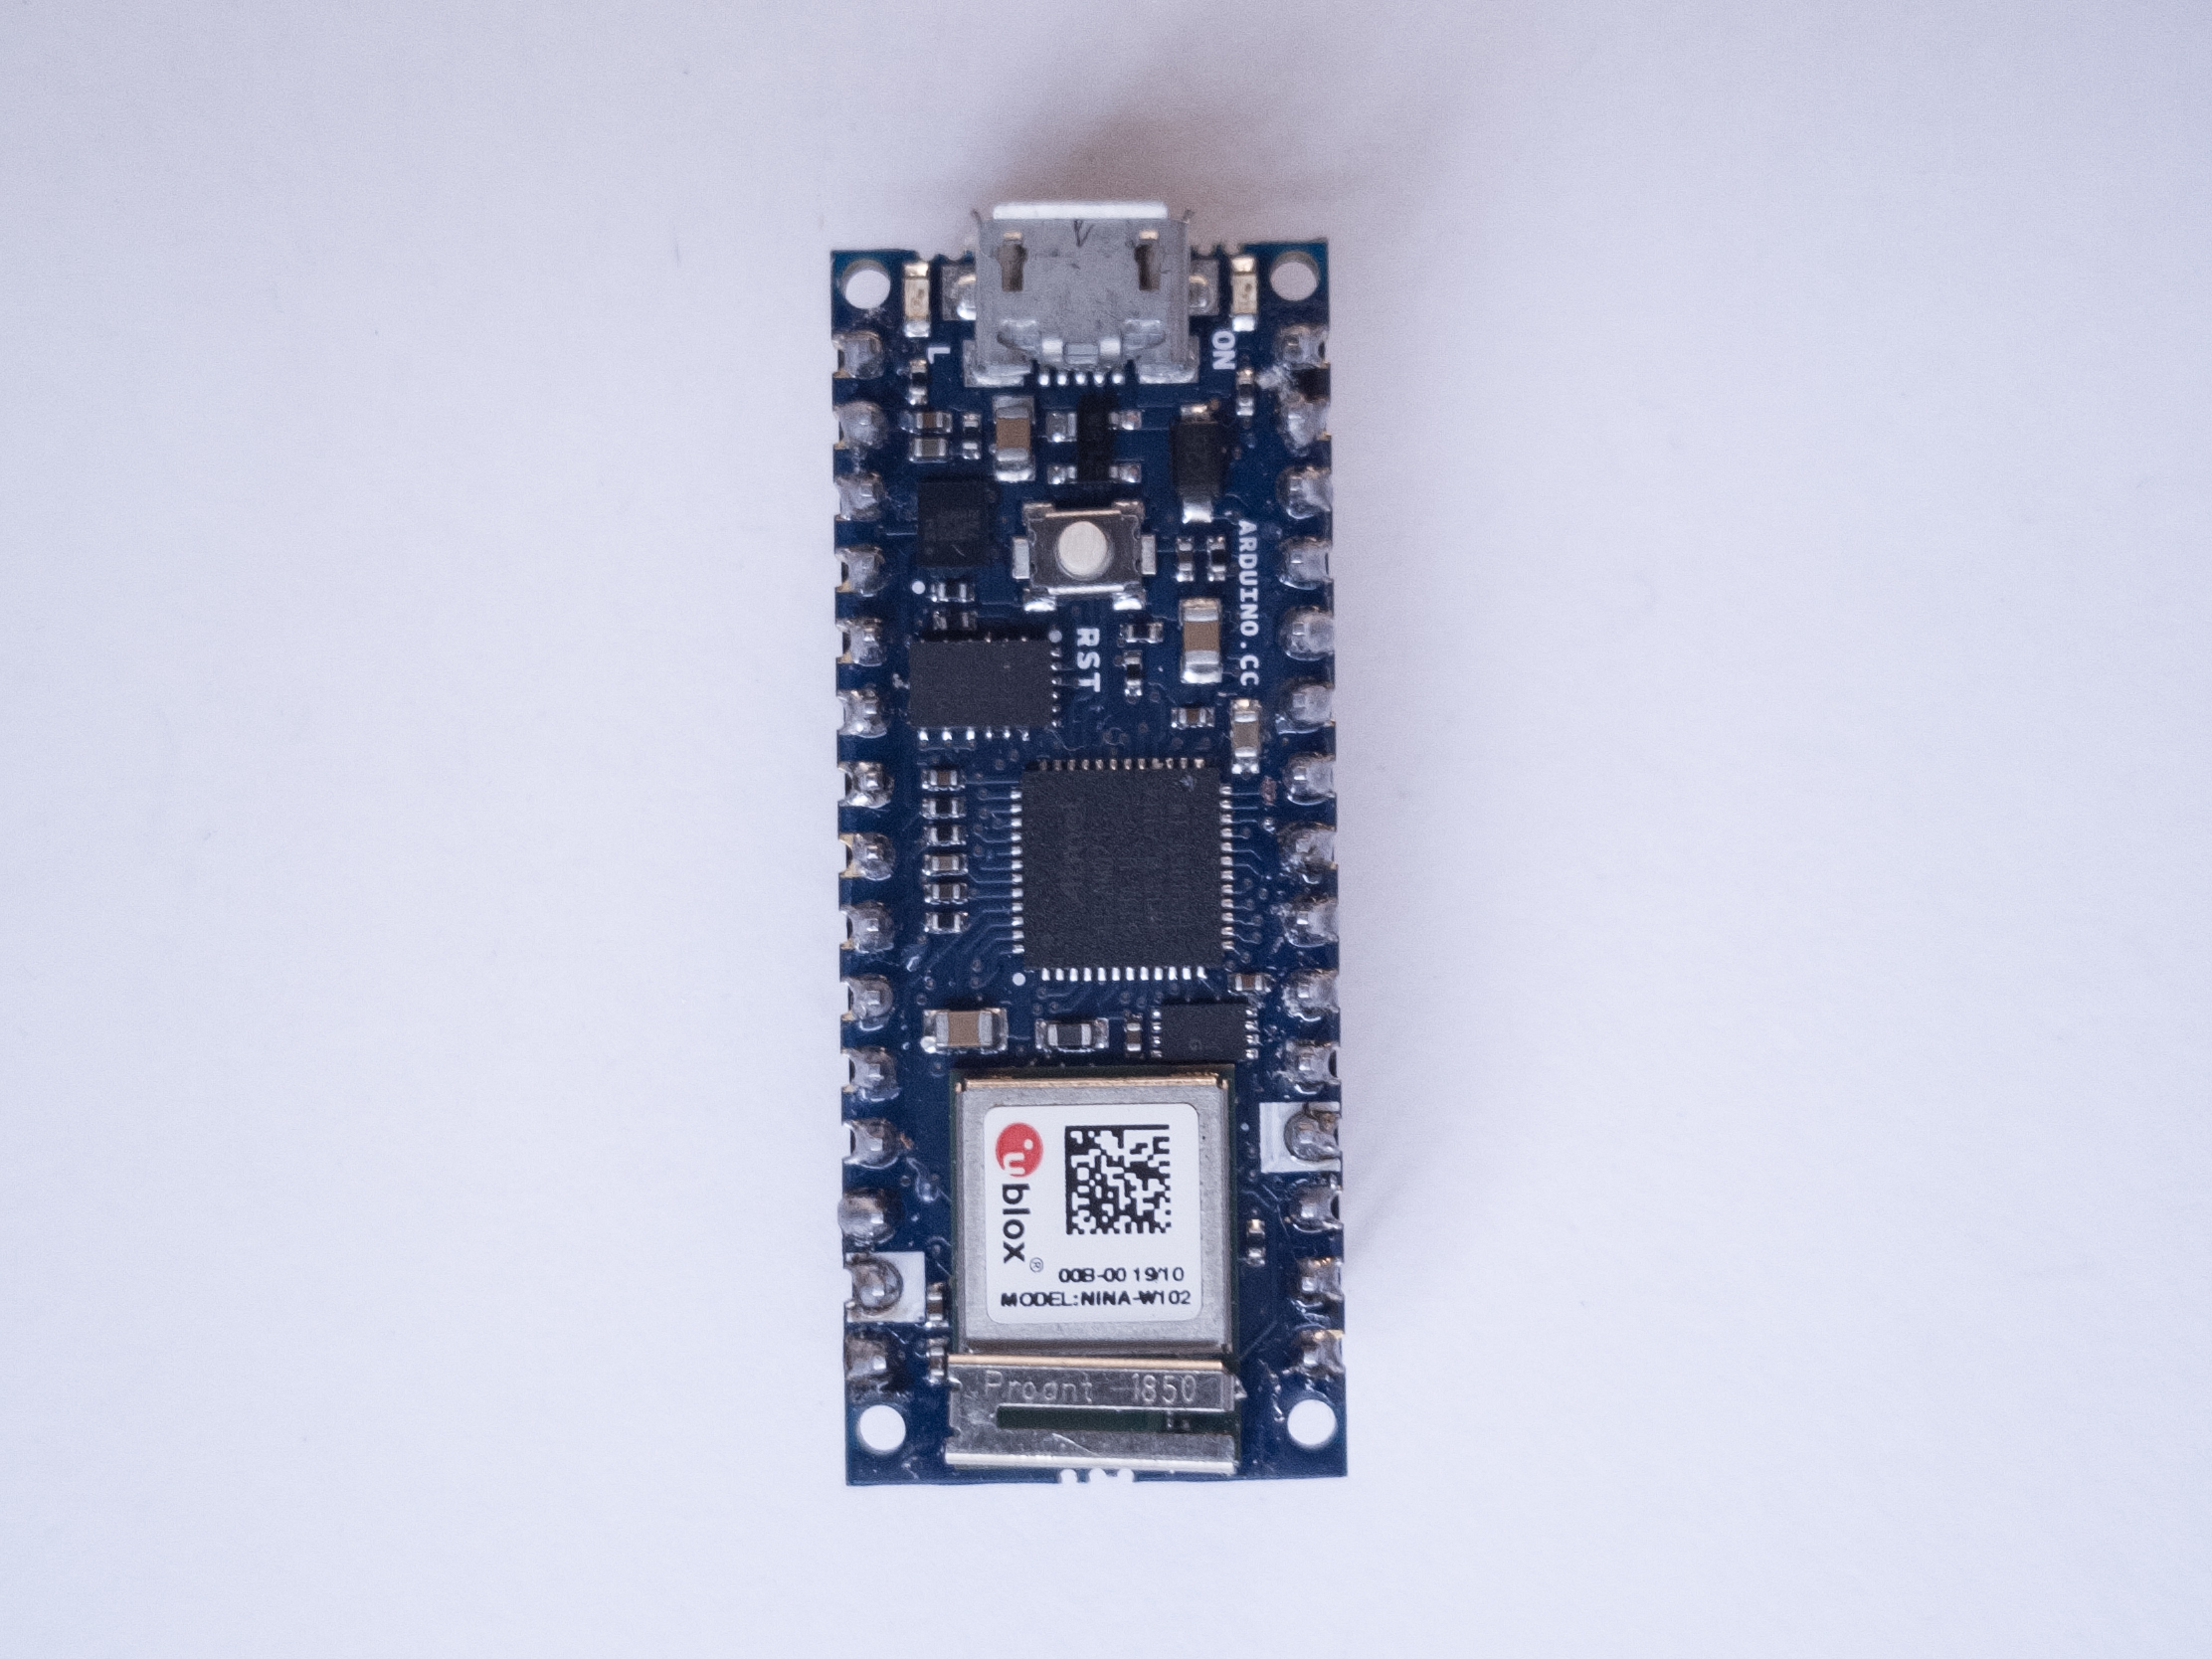
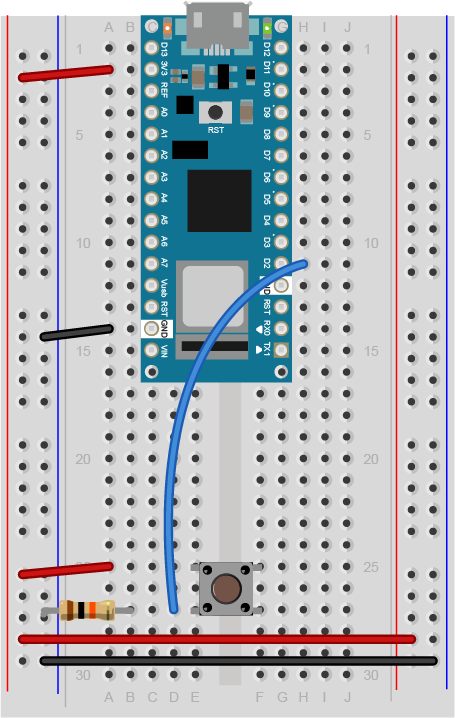
Figure 11 shows an Arduino Nano mounted on a solderless breadboard. The Nano is mounted at the top of the breadboard, straddling the center divide, with its USB connector facing up. The top pins of the Nano are in row 1 of the breadboard.
The Nano, like all Dual-Inline Package (DIP) modules, has its physical pins numbered in a U shape, from top left to bottom left, to bottom right to top right. The Nano’s 3.3V pin (physical pin 2) is connected to the left side red column of the breadboard. The Nano’s GND pin (physical pin 14) is connected to the left side black column. These columns on the side of a breadboard are commonly called the buses. The red line is the voltage bus, and the black or blue line is the ground bus. The blue columns (ground buses) are connected together at the bottom of the breadboard with a black wire. The red columns (voltage buses) are connected together at the bottom of the breadboard with a red wire.
Images made with Fritzing
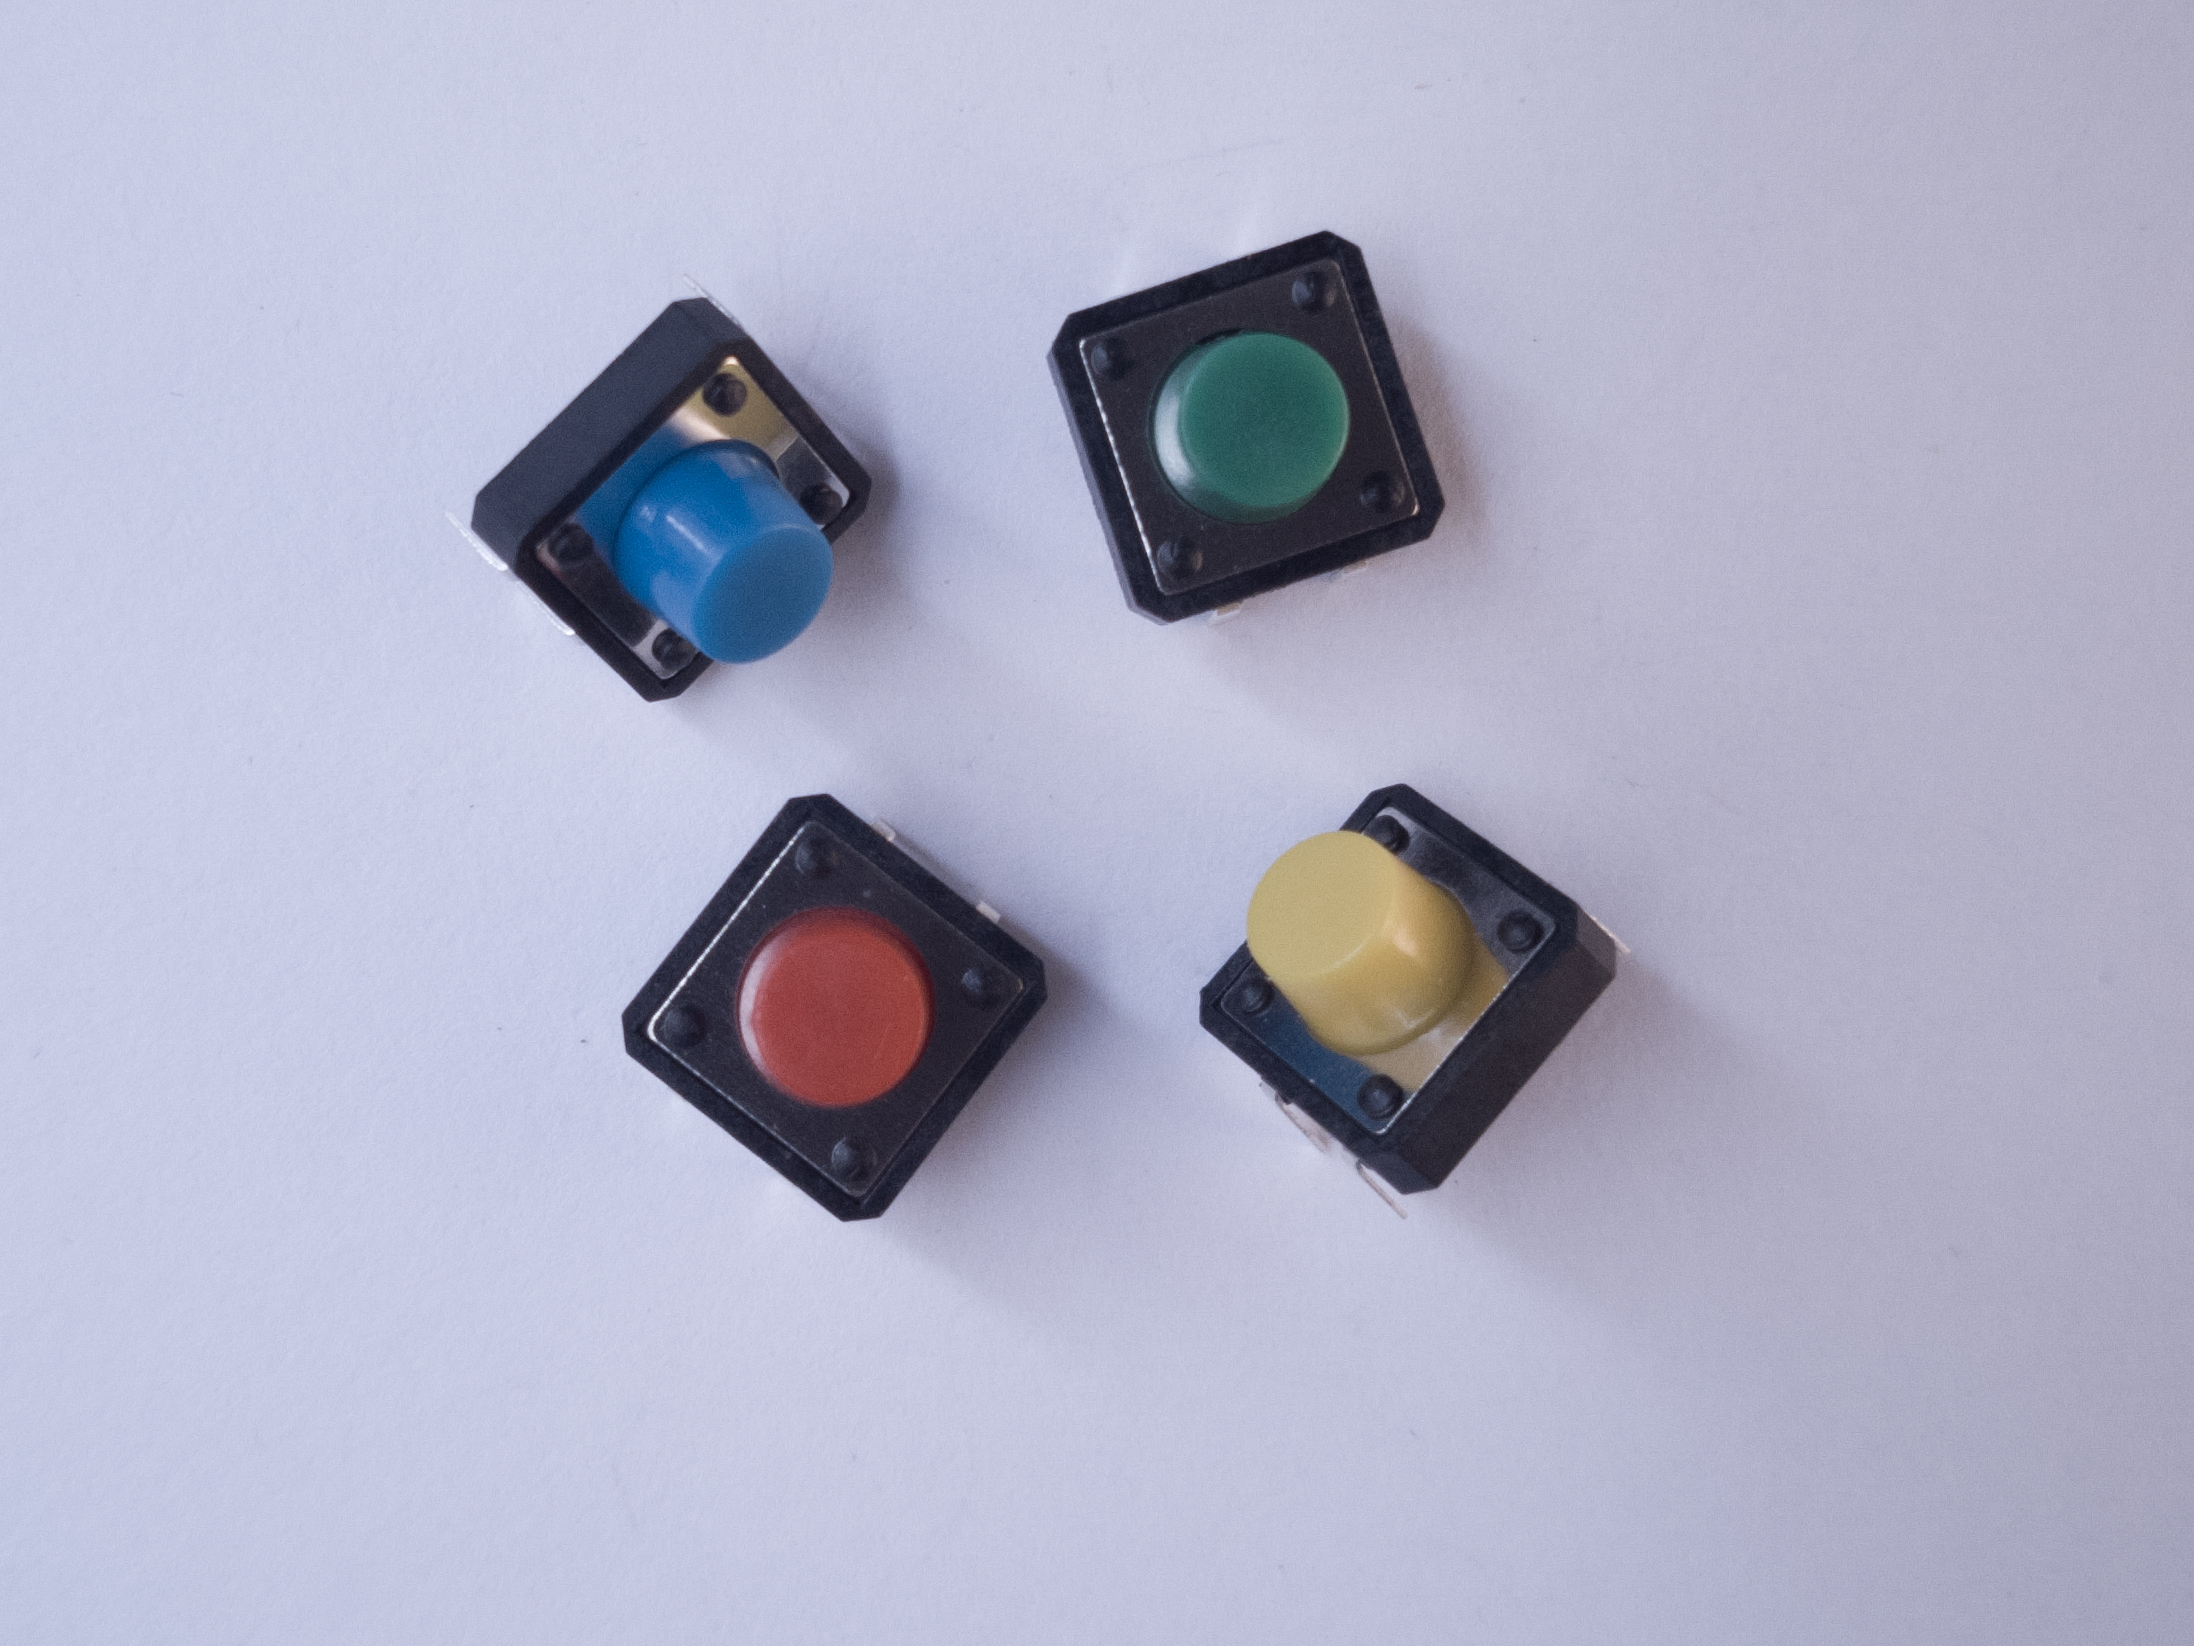
Add a pushbutton
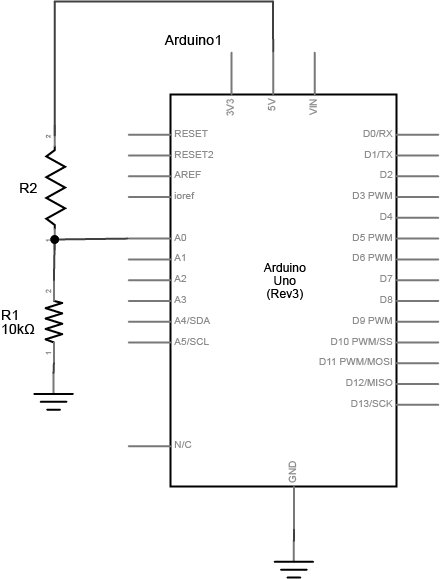
Connect a pushbutton to digital input 2 on the Arduino. Figures 12 and 13 show the schematic and breadboard views of this for an Arduino Uno, and Figure 14 shows the breadboard view for an Arduino 33 IoT.
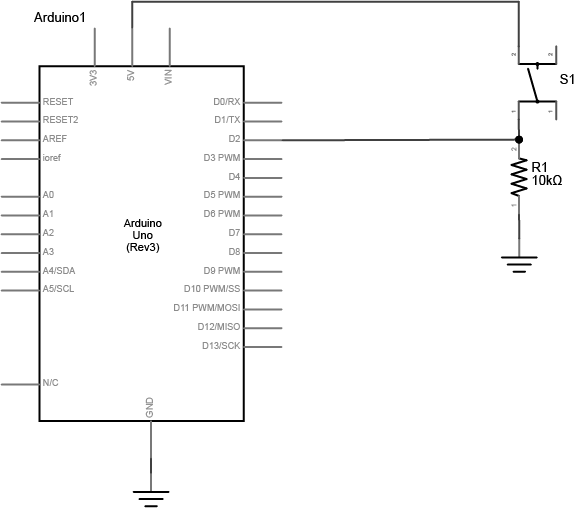
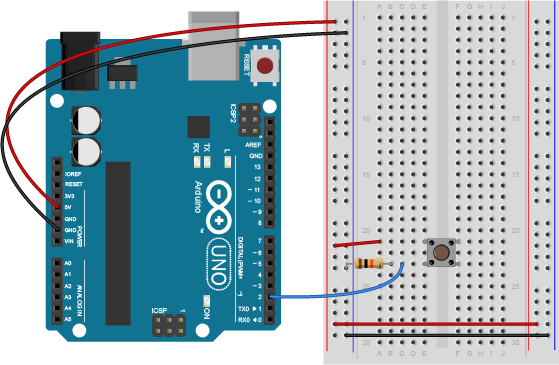
The +3.3 volts and ground pins of the Arduino are connected by red and black wires, respectively, to the left side rows of the breadboard. +3.3 volts is connected to the left outer side row (the voltage bus) and ground is connected to the left inner side row (the ground bus). The side rows on the left are connected to the side rows on the right using red and black wires, respectively, creating a voltage bus and a ground bus on both sides of the board. The pushbutton is mounted across the middle divide of the solderless breadboard. A 10-kilohm resistor connects from the same row as pushbutton’s bottom left pin to the ground bus on the breadboard. There is a wire connecting to digital pin 2 from the same row that connects the resistor and the pushbutton. The top left pin of the pushbutton is connected to +3.3V.
Program the Microcontroller to Read the Pushbutton’s State Change
In the Digital Lab you learned how to read a pushbutton using the digitalRead() command. To tell when a pushbutton is pushed, you need to determine when the button’s state changes from off to on. With the button wired as you have it here, the button’s state will change from 0 to 1. In order to know that, you need to know not only what the current state of the button is, but you also need to remember the state of the button the previous time you read it. This is called state change detection. To do this, set up a global variable to store the button’s previous state. Initialize the button in your program’s setup() function using the pinMode() command. Then, in the loop() function, write a block of code that reads the button and compares its state to the previous state variable. To do this, you need to read the button, check the current button state against the last state, then save the current state of the button in a variable for the next time through the loop like so:
int lastButtonState = LOW;    // state of the button last time you checked

void setup() {
  // make pin 2 an input:
  pinMode(2, INPUT);
}

void loop() {
  // read the pushbutton:
  int buttonState = digitalRead(2);

  // check if the current button state is different than the last state:
  if (buttonState != lastButtonState) {
     // do stuff if it is different here
  }

  // save button state for next comparison:
  lastButtonState = buttonState;
}
If buttonState is not equal to lastButtonState, then the button has changed. Then you want to check if the current state is HIGH. If it is, then you know the button has changed from LOW to HIGH. That means your user pressed it. Print out a message to that effect.
int lastButtonState = LOW;   // state of the button last time you checked

void setup() {
  // initialize serial communication:
  Serial.begin(9600);
  // make pin 2 an input:
  pinMode(2, INPUT);
}

void loop() {
  // read the pushbutton:
  int buttonState = digitalRead(2);

  // if it's changed and it's high, toggle the mouse state:
  if (buttonState != lastButtonState) {
    if (buttonState == HIGH) {
      Serial.println("Button was just pressed.");
    }
  }
  // save button state for next comparison:
  lastButtonState = buttonState;
}
Your code should only print out a message when the button changes state. For every button press, you should get one line of code. You can use this technique any time you need to tell when a digital input changes state.
Count Button Presses
One of the many things you can do with state change detection is to count the number of button presses. Each time the button changes from off to on, you know it’s been pressed once. By adding another global variable and incrementing it when you detect the button press, you can count the number of button presses. Add a global variable at the top of your program like so:
int lastButtonState = LOW;   // state of the button last time you checked
int buttonPresses = 0;       // count of button presses
Then in the if statement that detects the button press, add one to the button press:
 if (buttonState == HIGH) {
      buttonPresses++;
      Serial.print("Button has been pressed ");
      Serial.print(buttonPresses);
      Serial.println(" times.");
    }
The key to detecting state change is the use of a variable to save the current state for comparison the next time through the loop. This is a pattern you’ll see below as well:
int lastSensorState = LOW;   // sensor's previous state
// other globals and the setup go here

void loop() {
  // read the sensor:
  int sensorState = digitalRead(2);

  // if it's changed:
  if (sensorState != lastSensorState) {
    // take action or run a more detailed check
  }
  // save sensor state for next comparison:
  lastSensorState = sensorState;
}
Long Press, Short Press
Sometimes you want to take a different action on a short button press than you do on a long button press. To do this, you need to know now only when the button changes, but also how long it stays in a pressed state after it changes. Here’s how you might do that.
Start with some global variables for the button pin number, and the length of a long press or a short press, in milliseconds. You also need a variable to track how long the button has been pressed, and as in the code above, you need a variable to track the last button state. Add another variable called pressTime, which will keep track of the last time the button went from LOW to HIGH:
// the input pin:
int buttonPin = 2;

// the length of the presses in ms:
int longPress = 750;
int shortPress = 250;
// variable for how long the user actually presses:
long pressTime = 0;

// previous state of the button:
int lastButtonState = LOW;
In the setup(), set the button pin mode and initialize serial as you did before:
void setup() {
  // initialize serial and I/O pin:
  Serial.begin(9600);
  pinMode(buttonPin, INPUT);
}
In the loop, look for the button to change state, and when it does, note the press time in the pressTime variable. When the button is released (goes from HIGH to LOW), calculate how ling it was pressed, and print it:
void loop() {
  // read the button:
  int buttonState = digitalRead(buttonPin);

  // if the button has changed:
  if (buttonState != lastButtonState) {
    // if the button is pressed, start a timer:
    if (buttonState == HIGH) {
      pressTime = millis();
    }
    // if it's released, stop the timer:
    if (buttonState == LOW) {
      long holdTime = millis() - pressTime;
      // take action for long press, short press, or tap:
      if (holdTime > longPress) {
        Serial.println("long press");
      } else if (holdTime > shortPress) {
        Serial.println("short press");
      } else {
        Serial.println("Tap");
      }
    }
  }
  // save button state for next time:
  lastButtonState = buttonState;
}
You can see from this that you’ve actually got three states now, long press (> 750ms), short press (250-750ms), and tap (>250ms). With this, you can make one button do three things.
Analog Sensor Threshold Detection
When you’re using analog sensors, binary state change detection like you saw above is not usually effective, because your sensors can have multiple states. Remember, an analog sensor on an Arduino can have up to 1024 possible states. The simplest form of analog state change detection is to look for the sensor to rise above a given threshold in order to take action. However, if you want the action be triggered only once when your sensor passes the threshold, you need to keep track of both its current state and previous state.
Change the Breadboard
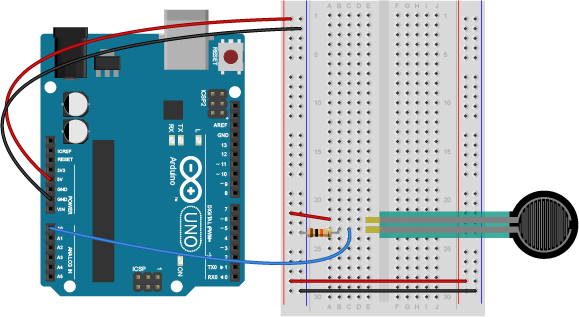
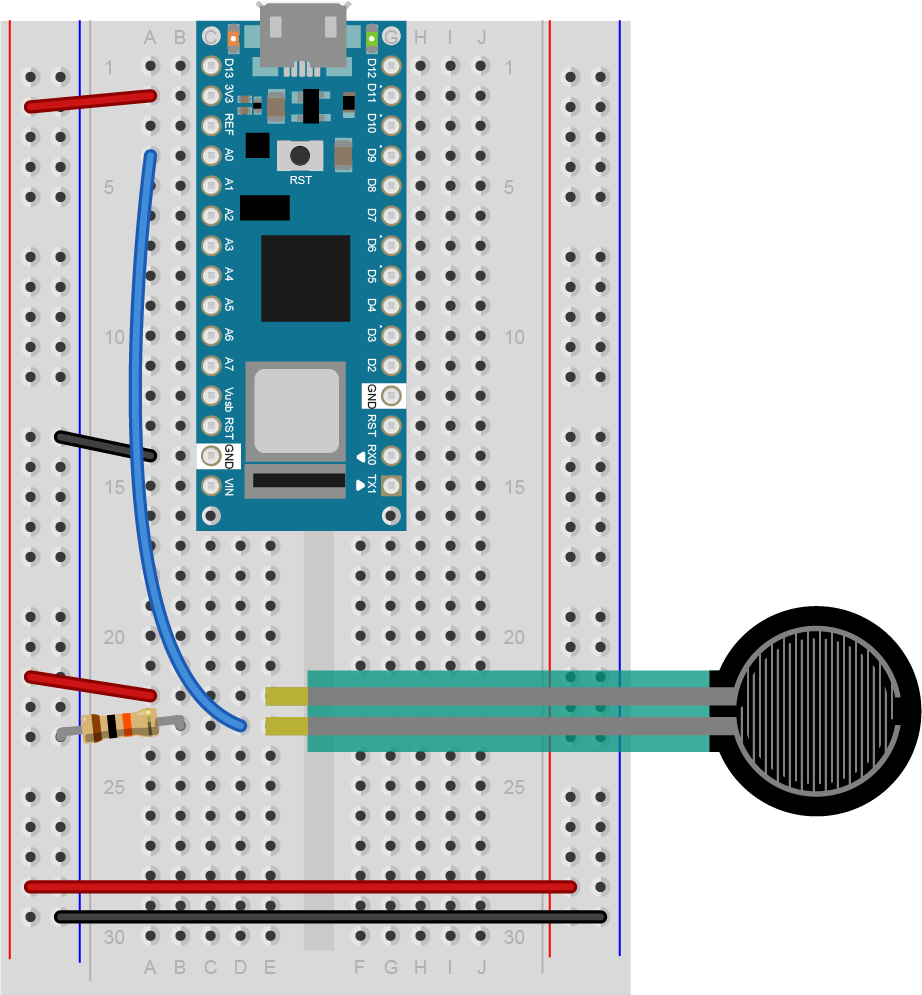
To build this example, you’ll need an analog sensor attached to your microcontroller, as shown in the Analog Input lab. Figures 15-17 show how to connect it.
Program the Microcontroller to Read a Sensor Threshold Crossing
This example is very similar to the one above:
int lastSensorState = LOW;   // sensor's previous state
int threshold = 512;   // an arbitrary threshold value

void setup() {
  Serial.begin(9600);
}

void loop() {
  // read the sensor:
  int sensorState = analogRead(A0);

  // if it's above the threshold:
  if (sensorState >= threshold) {
    // check that the previous value was below the threshold:
     if (lastSensorState < threshold) {
        // the sensor just crossed the threshold
        Serial.println("Sensor crossed the threshold");
     }
  }
  // save button state for next comparison:
  lastSensorState = sensorState;
}
This program will give you an alert only when the sensor value crosses the threshold when it’s rising. You won’t get any reading when it crosses the threshold when it’s falling, and you’ll only get one message when it crosses the threshold. It is possible to sense a threshold crossing when the sensor is falling, by reversing the greater than and less than signs in the example above. The threshold you set depends on your application. For example, if you’re using a light sensor to detect when it’s dark enough to turn on artificial lighting, you’d use the example above, and turn on the light when the threshold crossing happens. But you might also need to check for the falling threshold crossing to turn off the light.
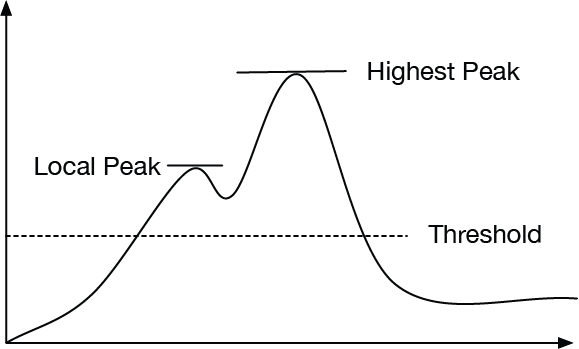
Detecting a Peak
There are times when you need to know when an analog sensor reaches its highest value in a given time period. This is called a peak. To detect a peak, you first set an initial peak value at zero. Pick a threshold below which you don’t care about peak values. Any time the sensor value rises above the peak value, you set the peak value equal to the sensor value. When the sensor value starts to fall, the peak will remain with the highest value:
int peakValue = 0;
int threshold = 50;   //set your own value based on your sensors

void setup() {
  Serial.begin(9600);
}

void loop() {
  //read sensor on pin A0:
  int sensorValue = analogRead(A0);
  // check if it's higher than the current peak:
  if (sensorValue > peakValue) {
    peakValue = sensorValue;
  }
}
You only really know you have a peak when you’ve passed it, however. When the current sensor value is less than the last reading you saved as the peak value, you know that last value was a peak. When the sensor value falls past below threshold after you have a peak, but your peak value is above the threshold, then you know you’ve got a significant peak value. after you use that peak value, you need to reset the variable to 0 to detect other peaks :
int peakValue = 0;
int threshold = 50;   //set your own value based on your sensors

void setup() {
  Serial.begin(9600);
}

void loop() {
  //read sensor on pin A0:
  int sensorValue = analogRead(A0);
  // check if it's higher than the current peak:
  if (sensorValue > peakValue) {
    peakValue = sensorValue;
  }
  if (sensorValue <= threshold) {
    if (peakValue > threshold) {
      // you have a peak value:
      Serial.println(peakValue);
      // reset the peak variable:
      peakValue = 0;
    }
  }
}
Dealing with Noise
Quite often, you get noise from sensor readings that can interfere with peak readings. Instead of a simple curve, you get a jagged rising edge filled with many local peaks, as shown in Figure 18:
You can smooth out the noise and ignore some of these local peaks by adding in a noise variable and checking to see if the sensor’s change is different than the previous reading and the noise combined, like so:
int peakValue = 0;
int threshold = 50;   //set your own value based on your sensors
int noise = 5;        //set a noise value based on your particular sensor

void setup() {
  Serial.begin(9600);
}

void loop() {
  //read sensor on pin A0:
  int sensorValue = analogRead(A0);
  // check if it's higher than the current peak:
  if (sensorValue > peakValue) {
    peakValue = sensorValue;
  }
  if (sensorValue <= threshold - noise ) {
    if (peakValue > threshold + noise) {
      // you have a peak value:
      Serial.println(peakValue);
      // reset the peak value:
      peakValue = 0;
    }
  }
}
Most sensor change cases can be described using a combination of state change detection, threshold crossing, and peak detection. When you start to write sensor change detection routines, make sure you understand these three basic techniques, and make sure you have a good idea what your sensor’s readings look like over time. With that combination, you should be able to detect most simple sensor change events.