Introduction
In this lab, you’ll learn how to connect a variable resistor to a microcontroller and read it as an analog input. You’ll be able to read changing conditions from the physical world and convert them to changing variables in a program.
Many of the most useful sensors you might connect to a microcontroller are analog input sensors. They deliver a variable voltage, which you read on the analog input pins using the analogRead() command.
What You’ll Need to Know
To get the most out of this lab, you should be familiar with the following concepts and you should install the Arduino IDE on your computer. You can check how to do so in the links below:
- What is a microcontroller
- Beginning programming terms
- What variables are
- The basics of electricity
- What is a solderless breadboard
- The basics of Digital input and output with Arduino
Things You’ll Need
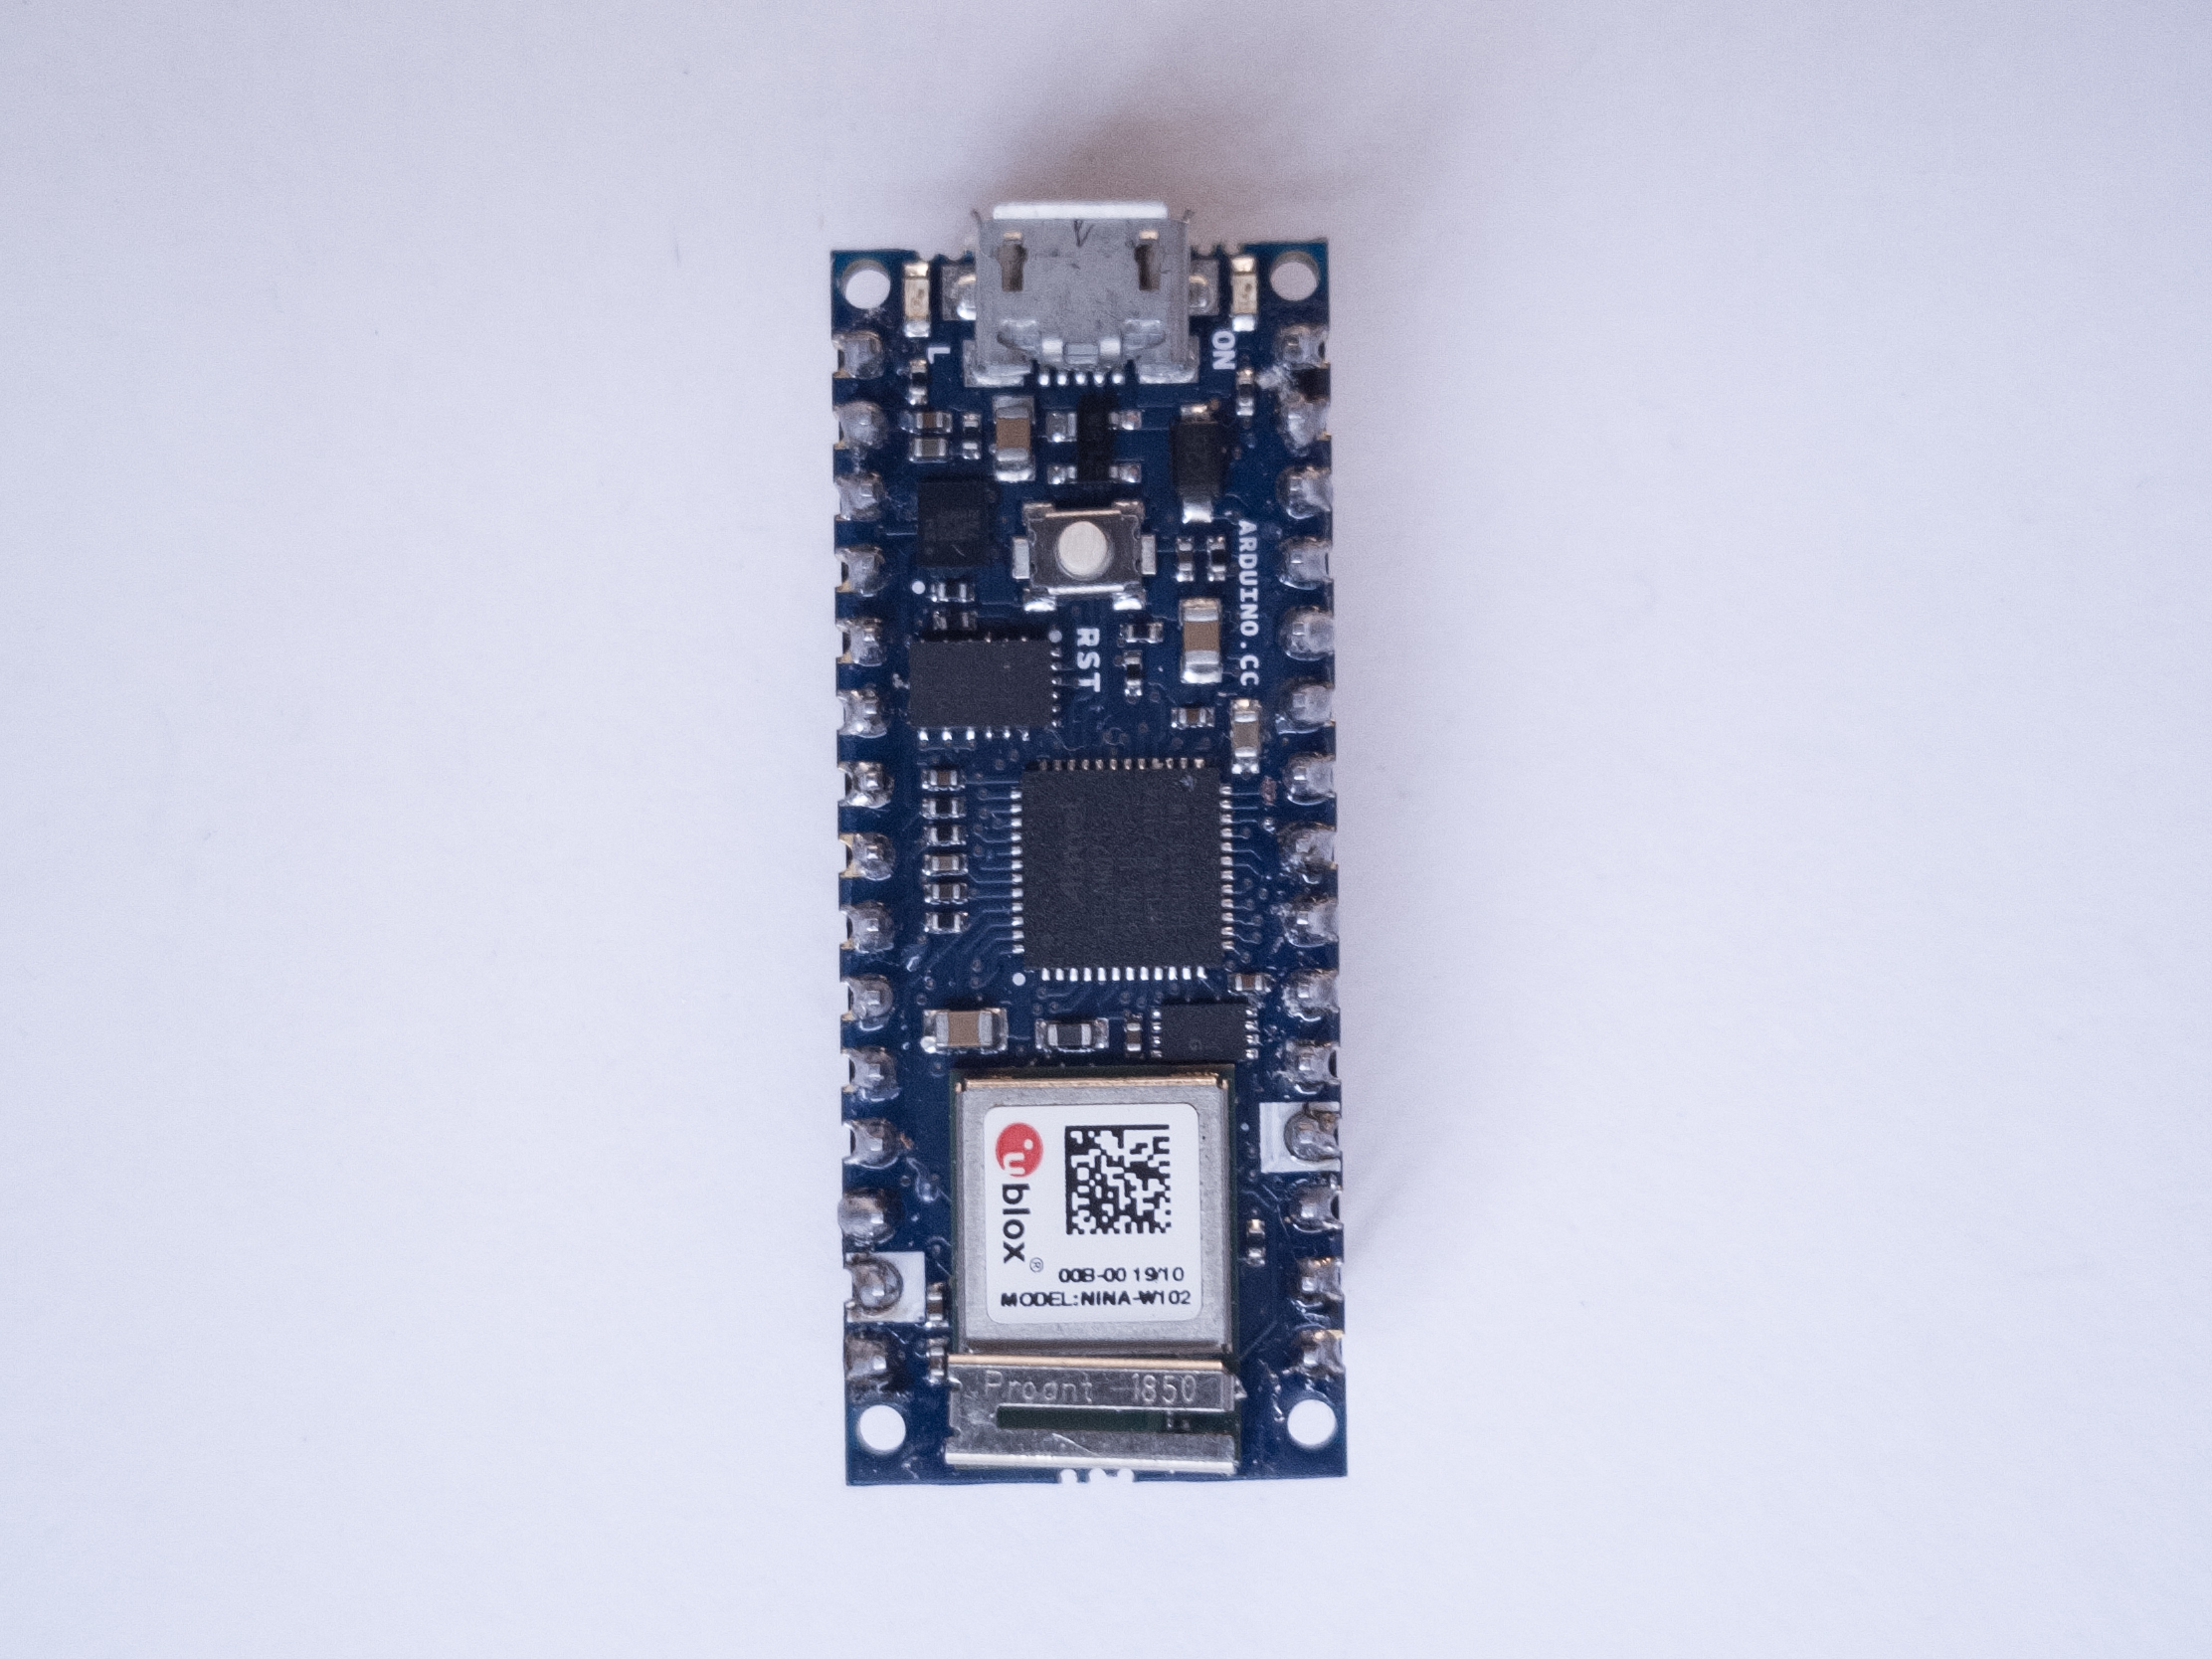
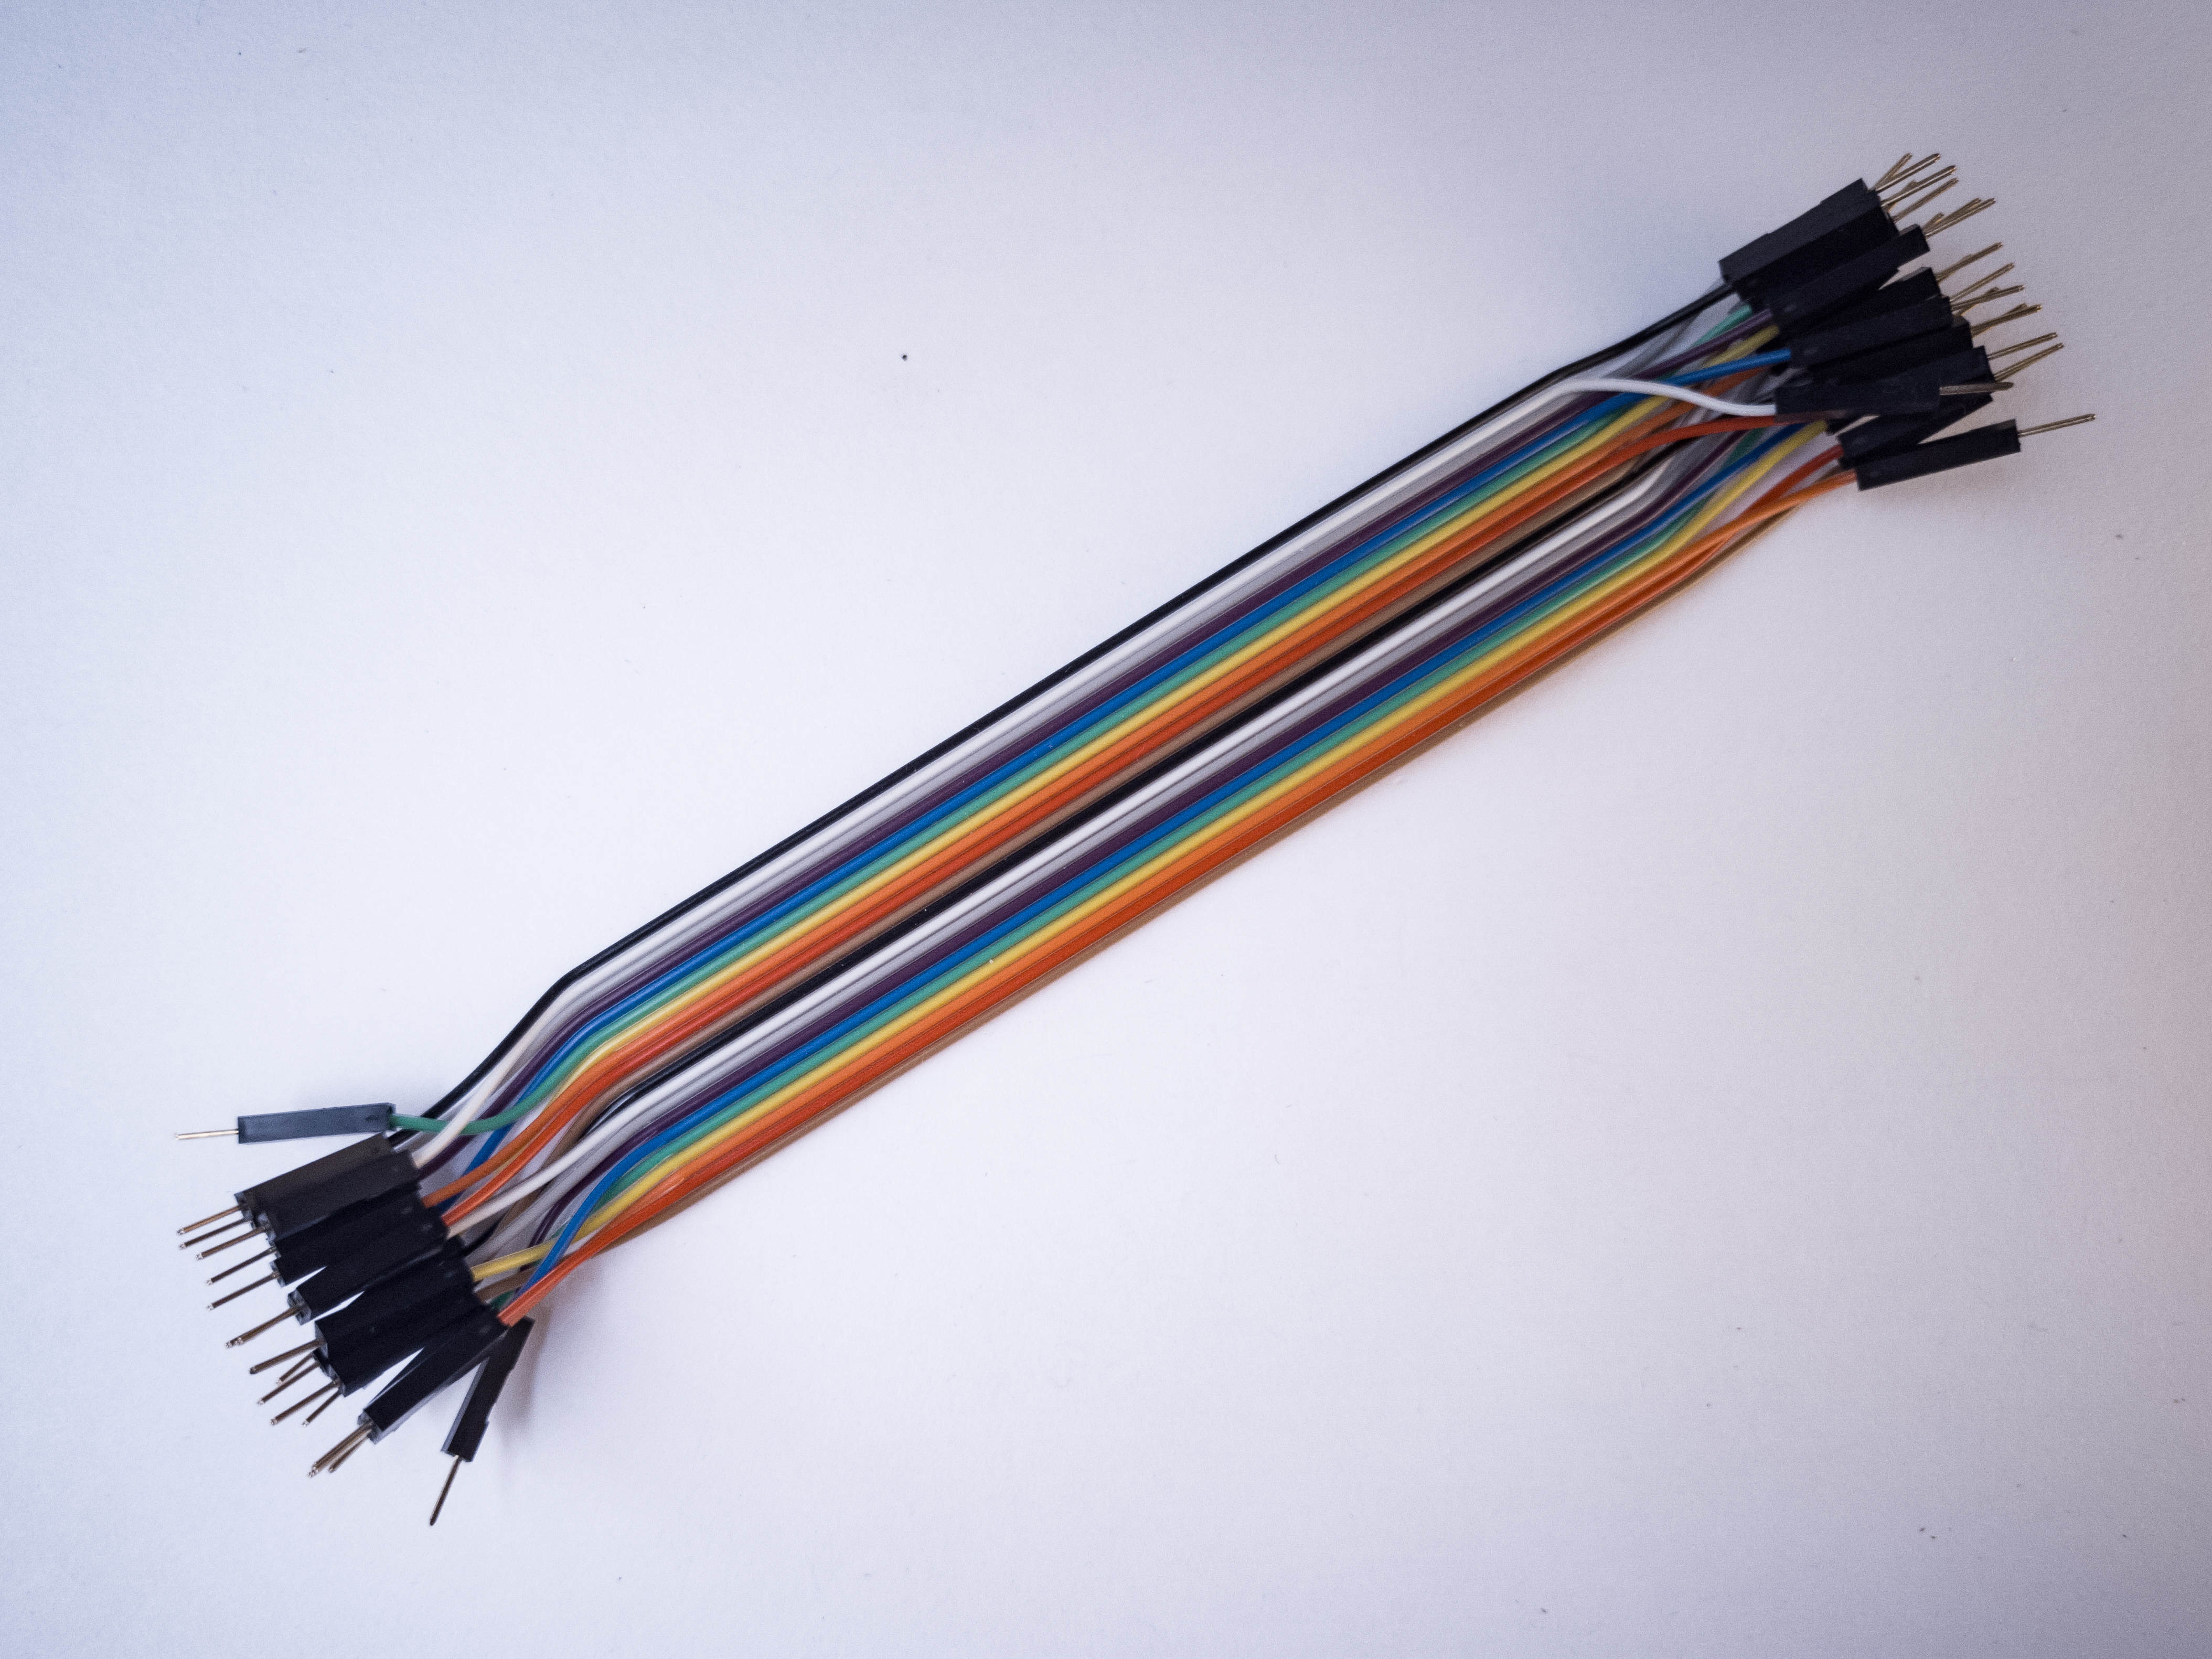
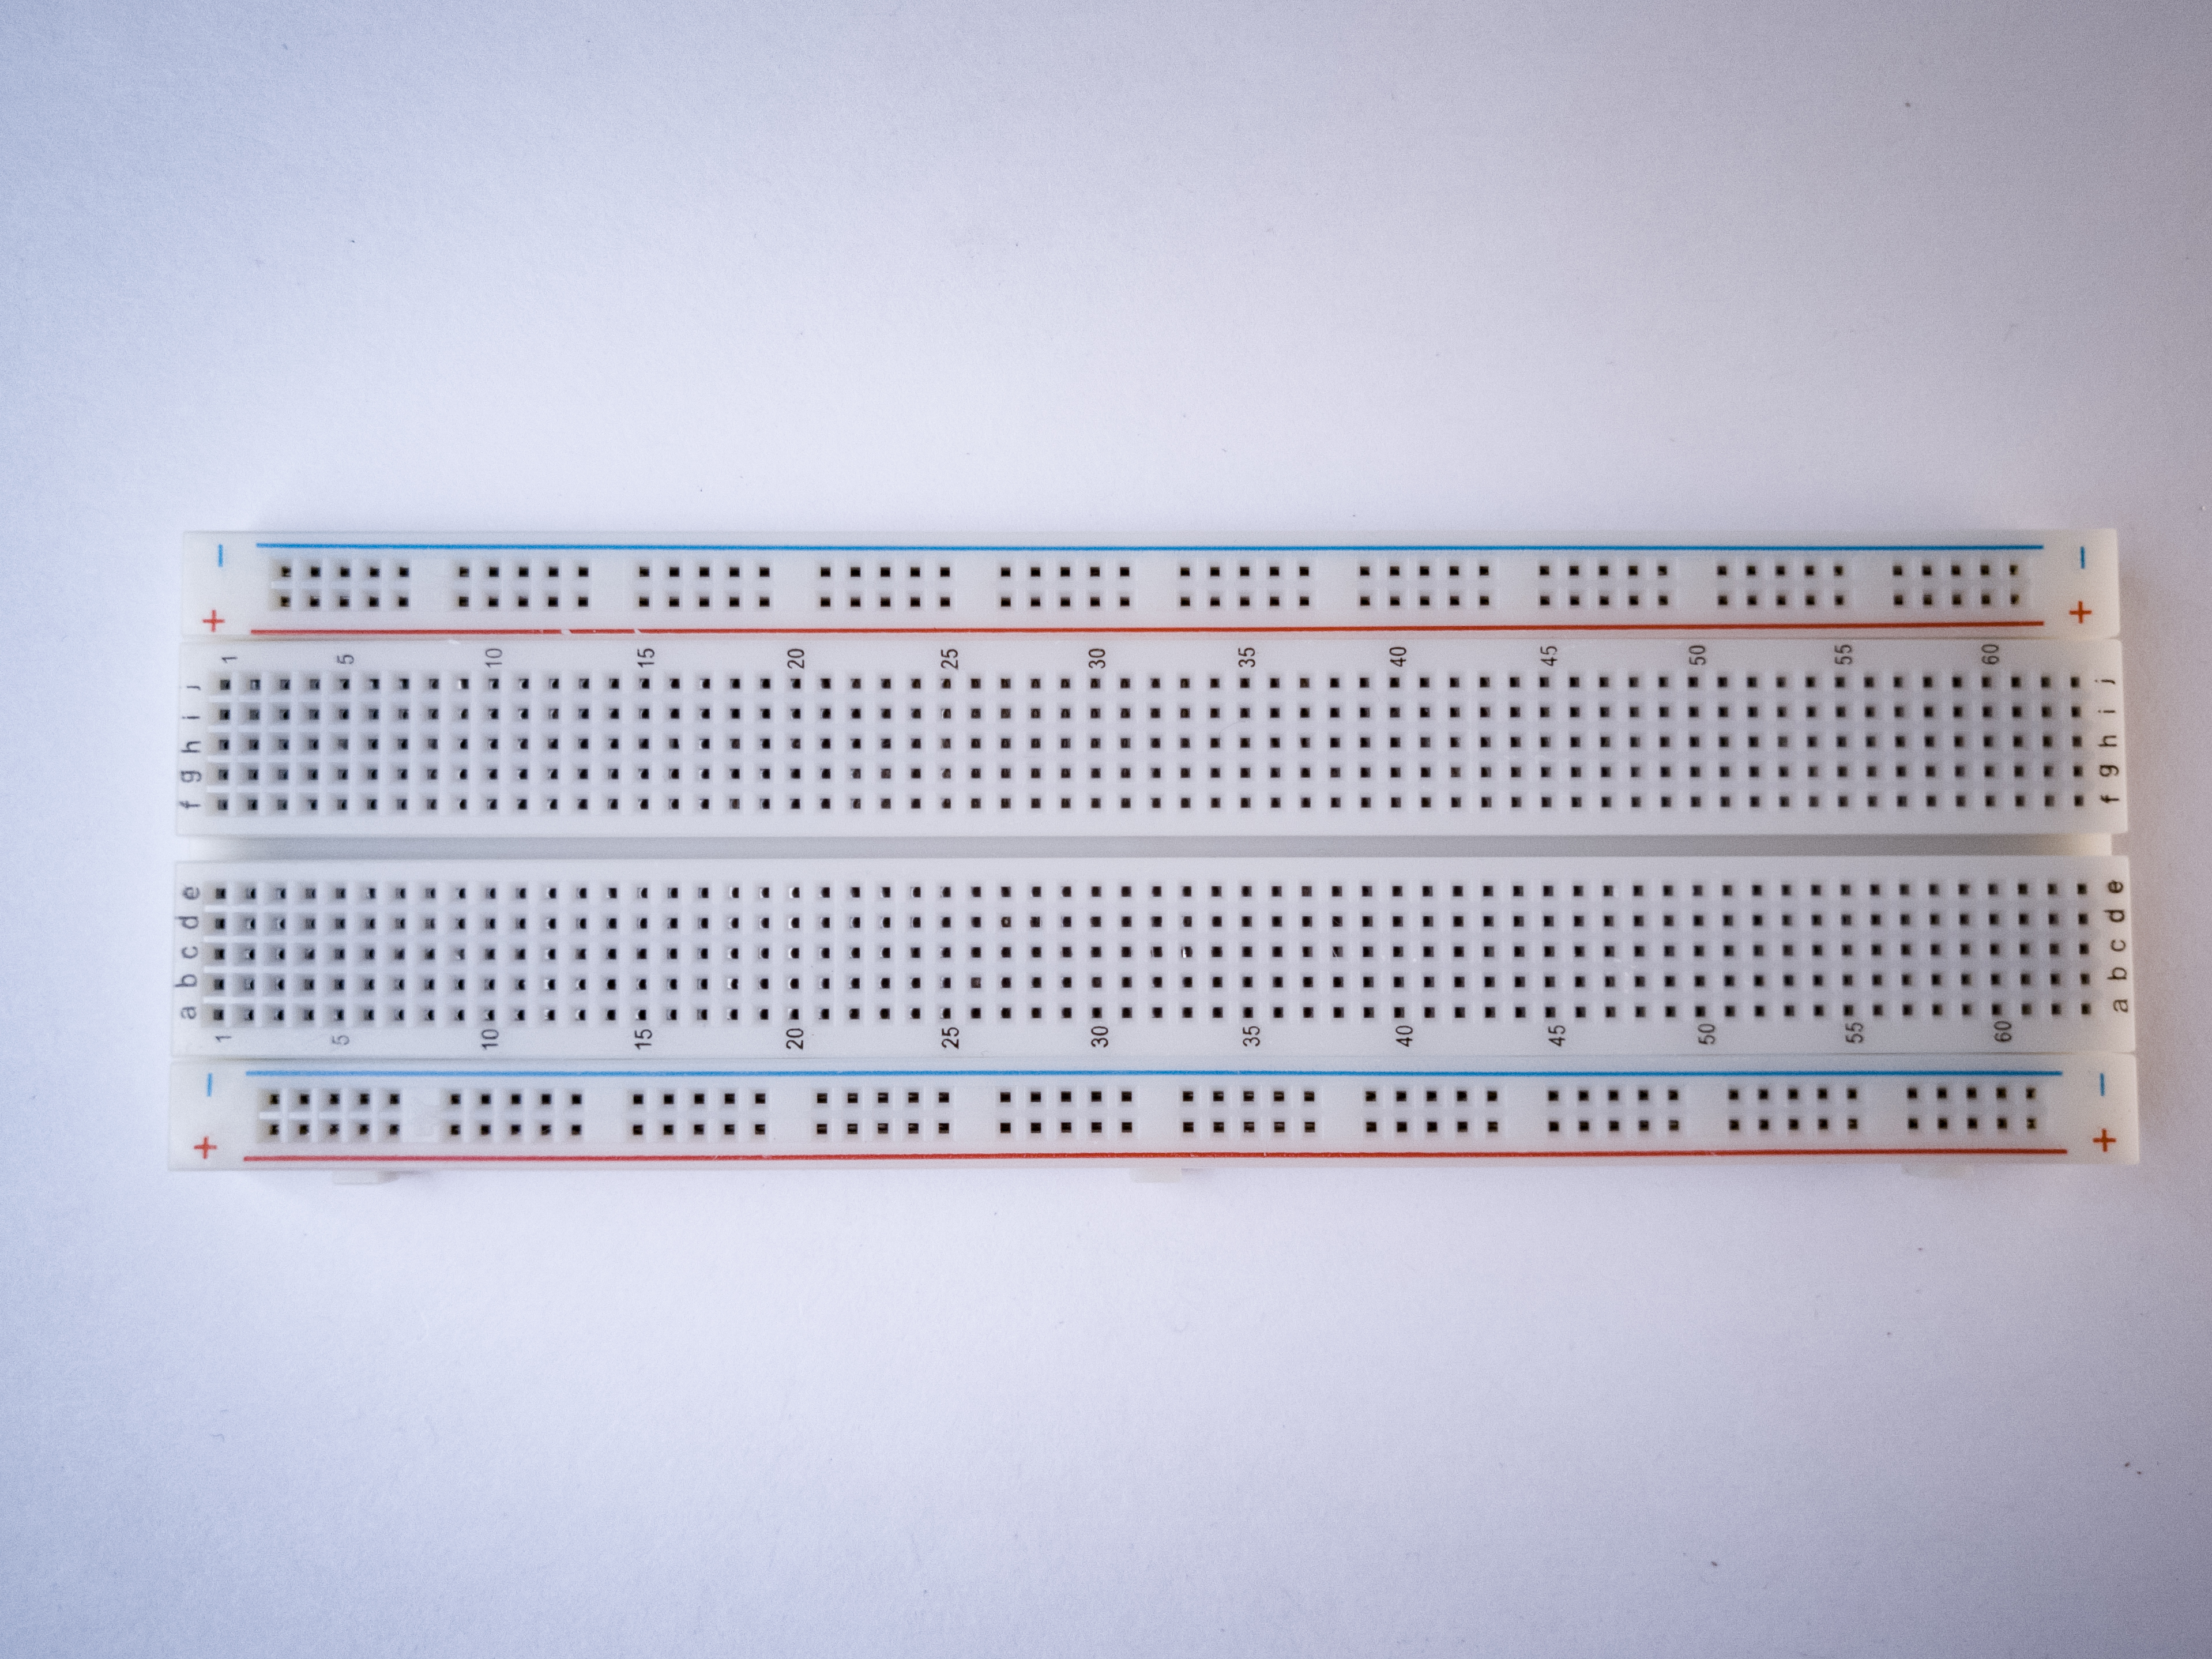
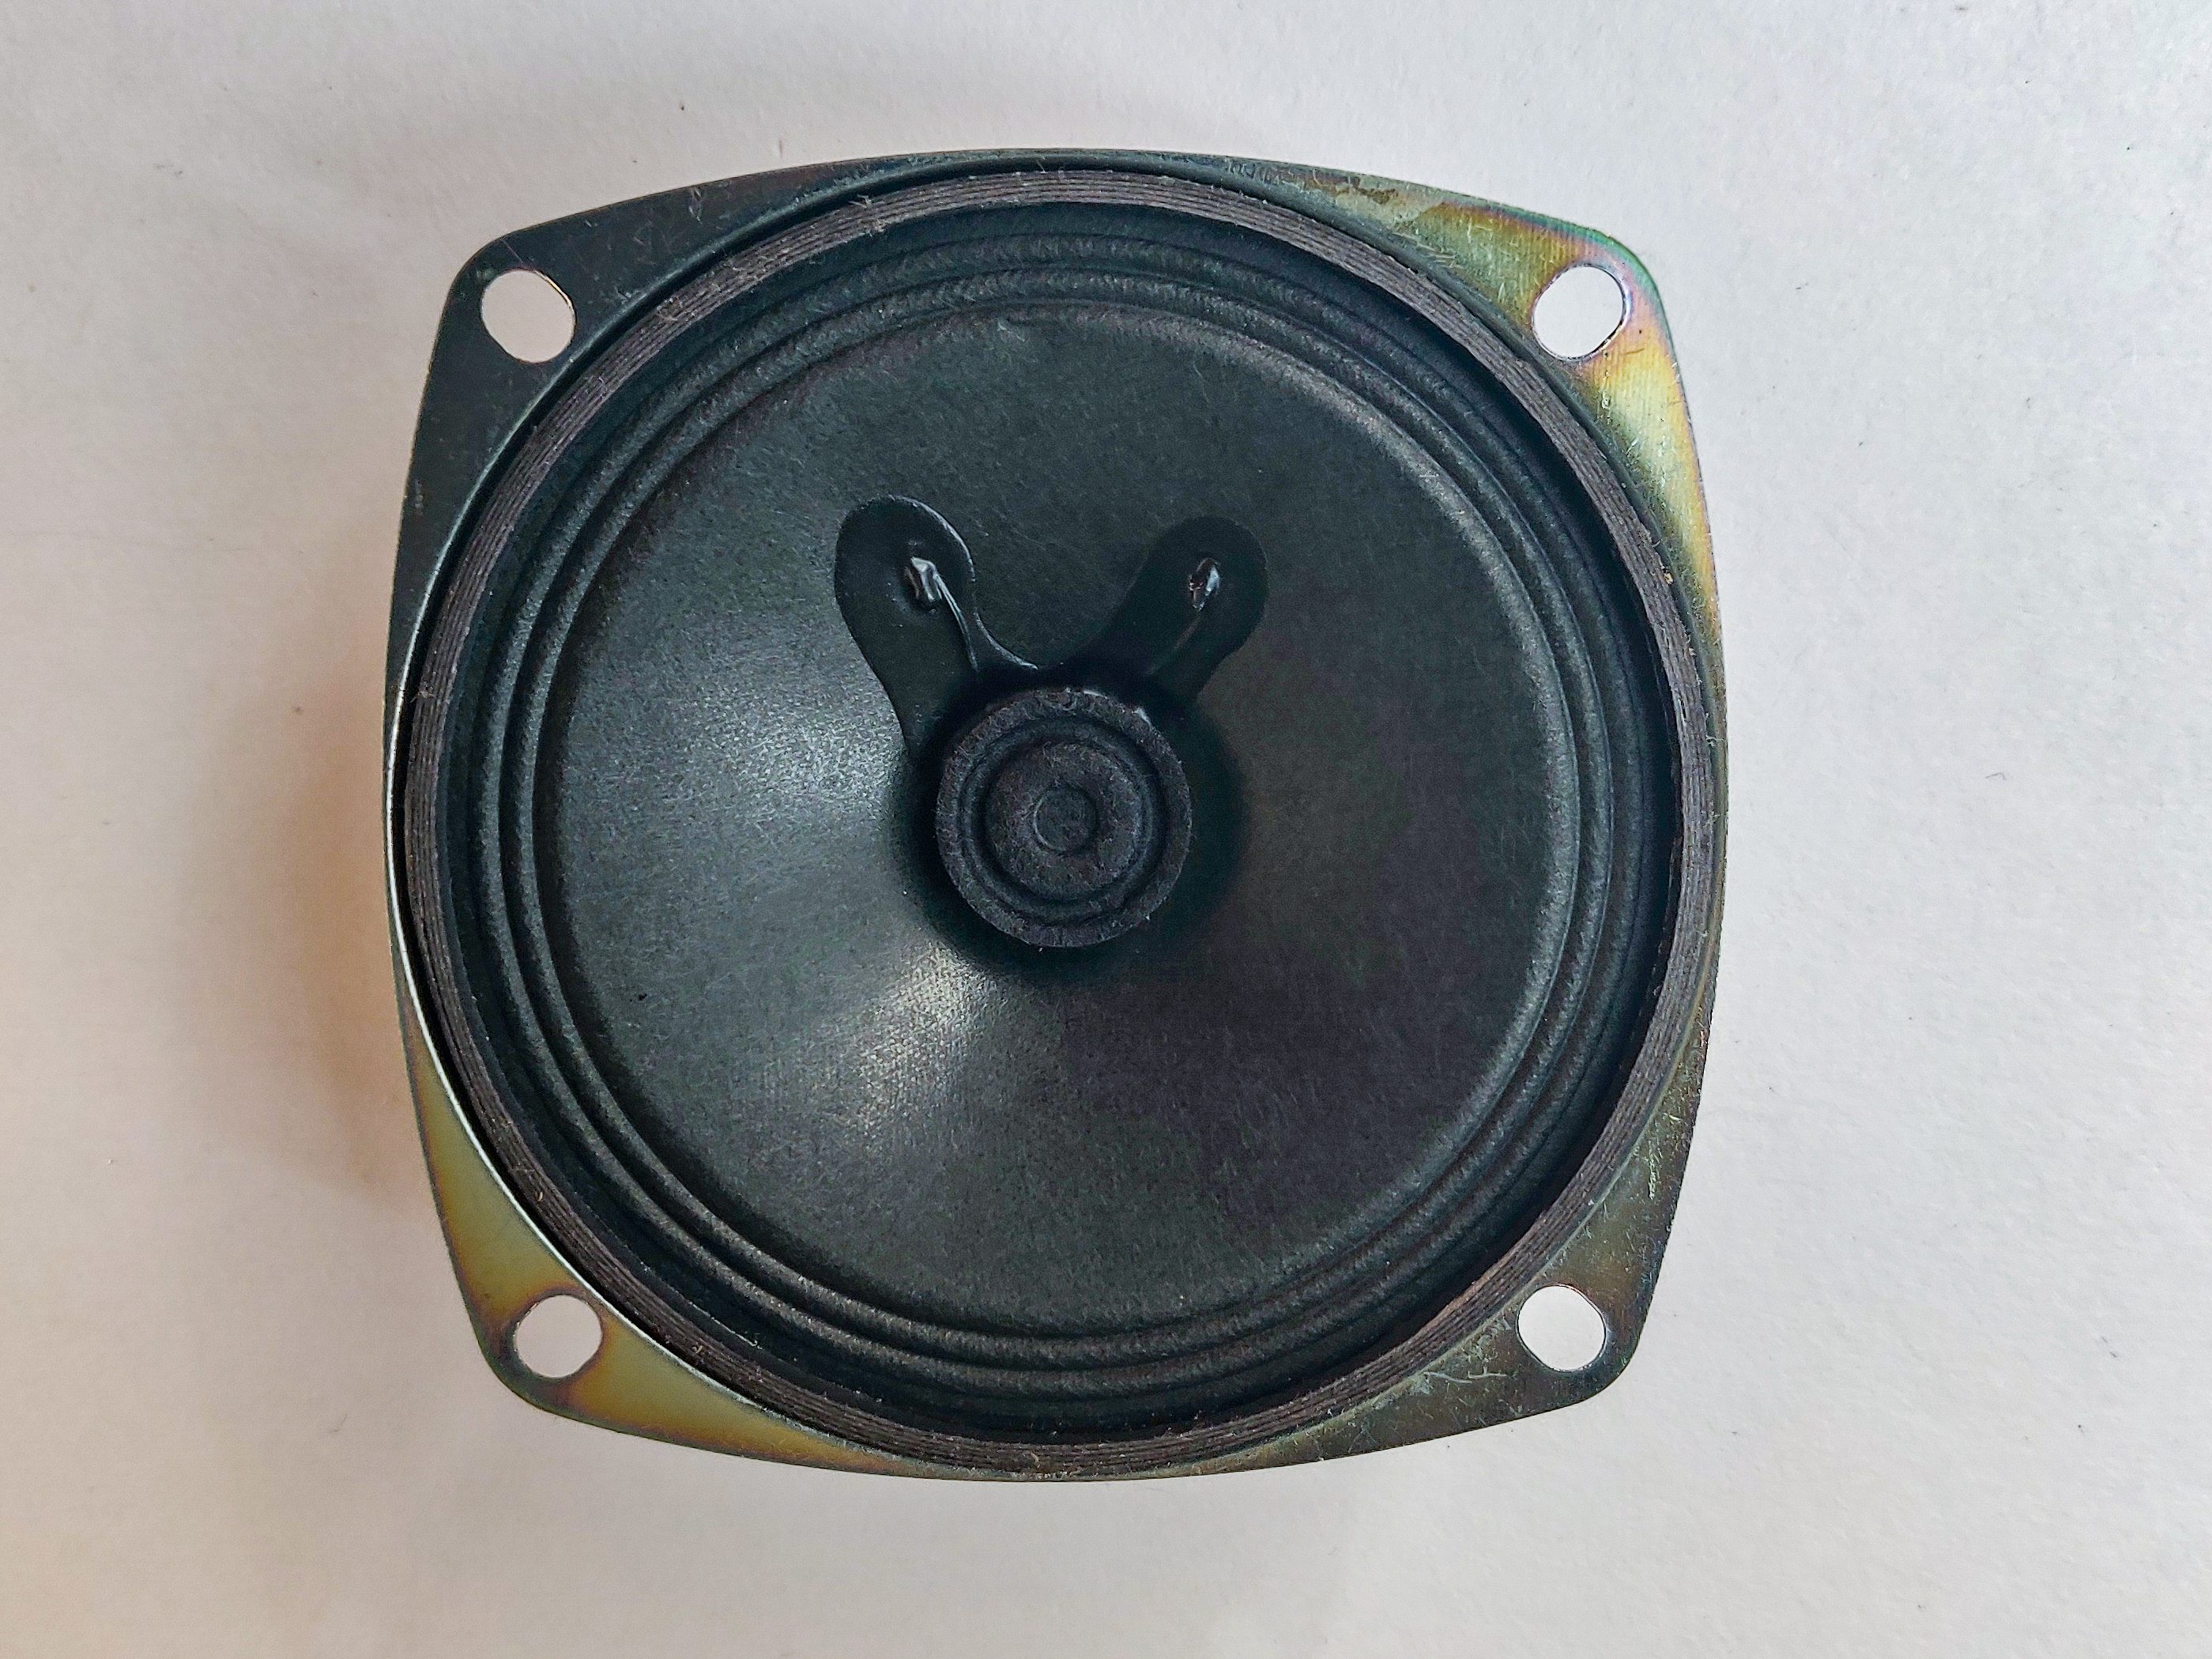
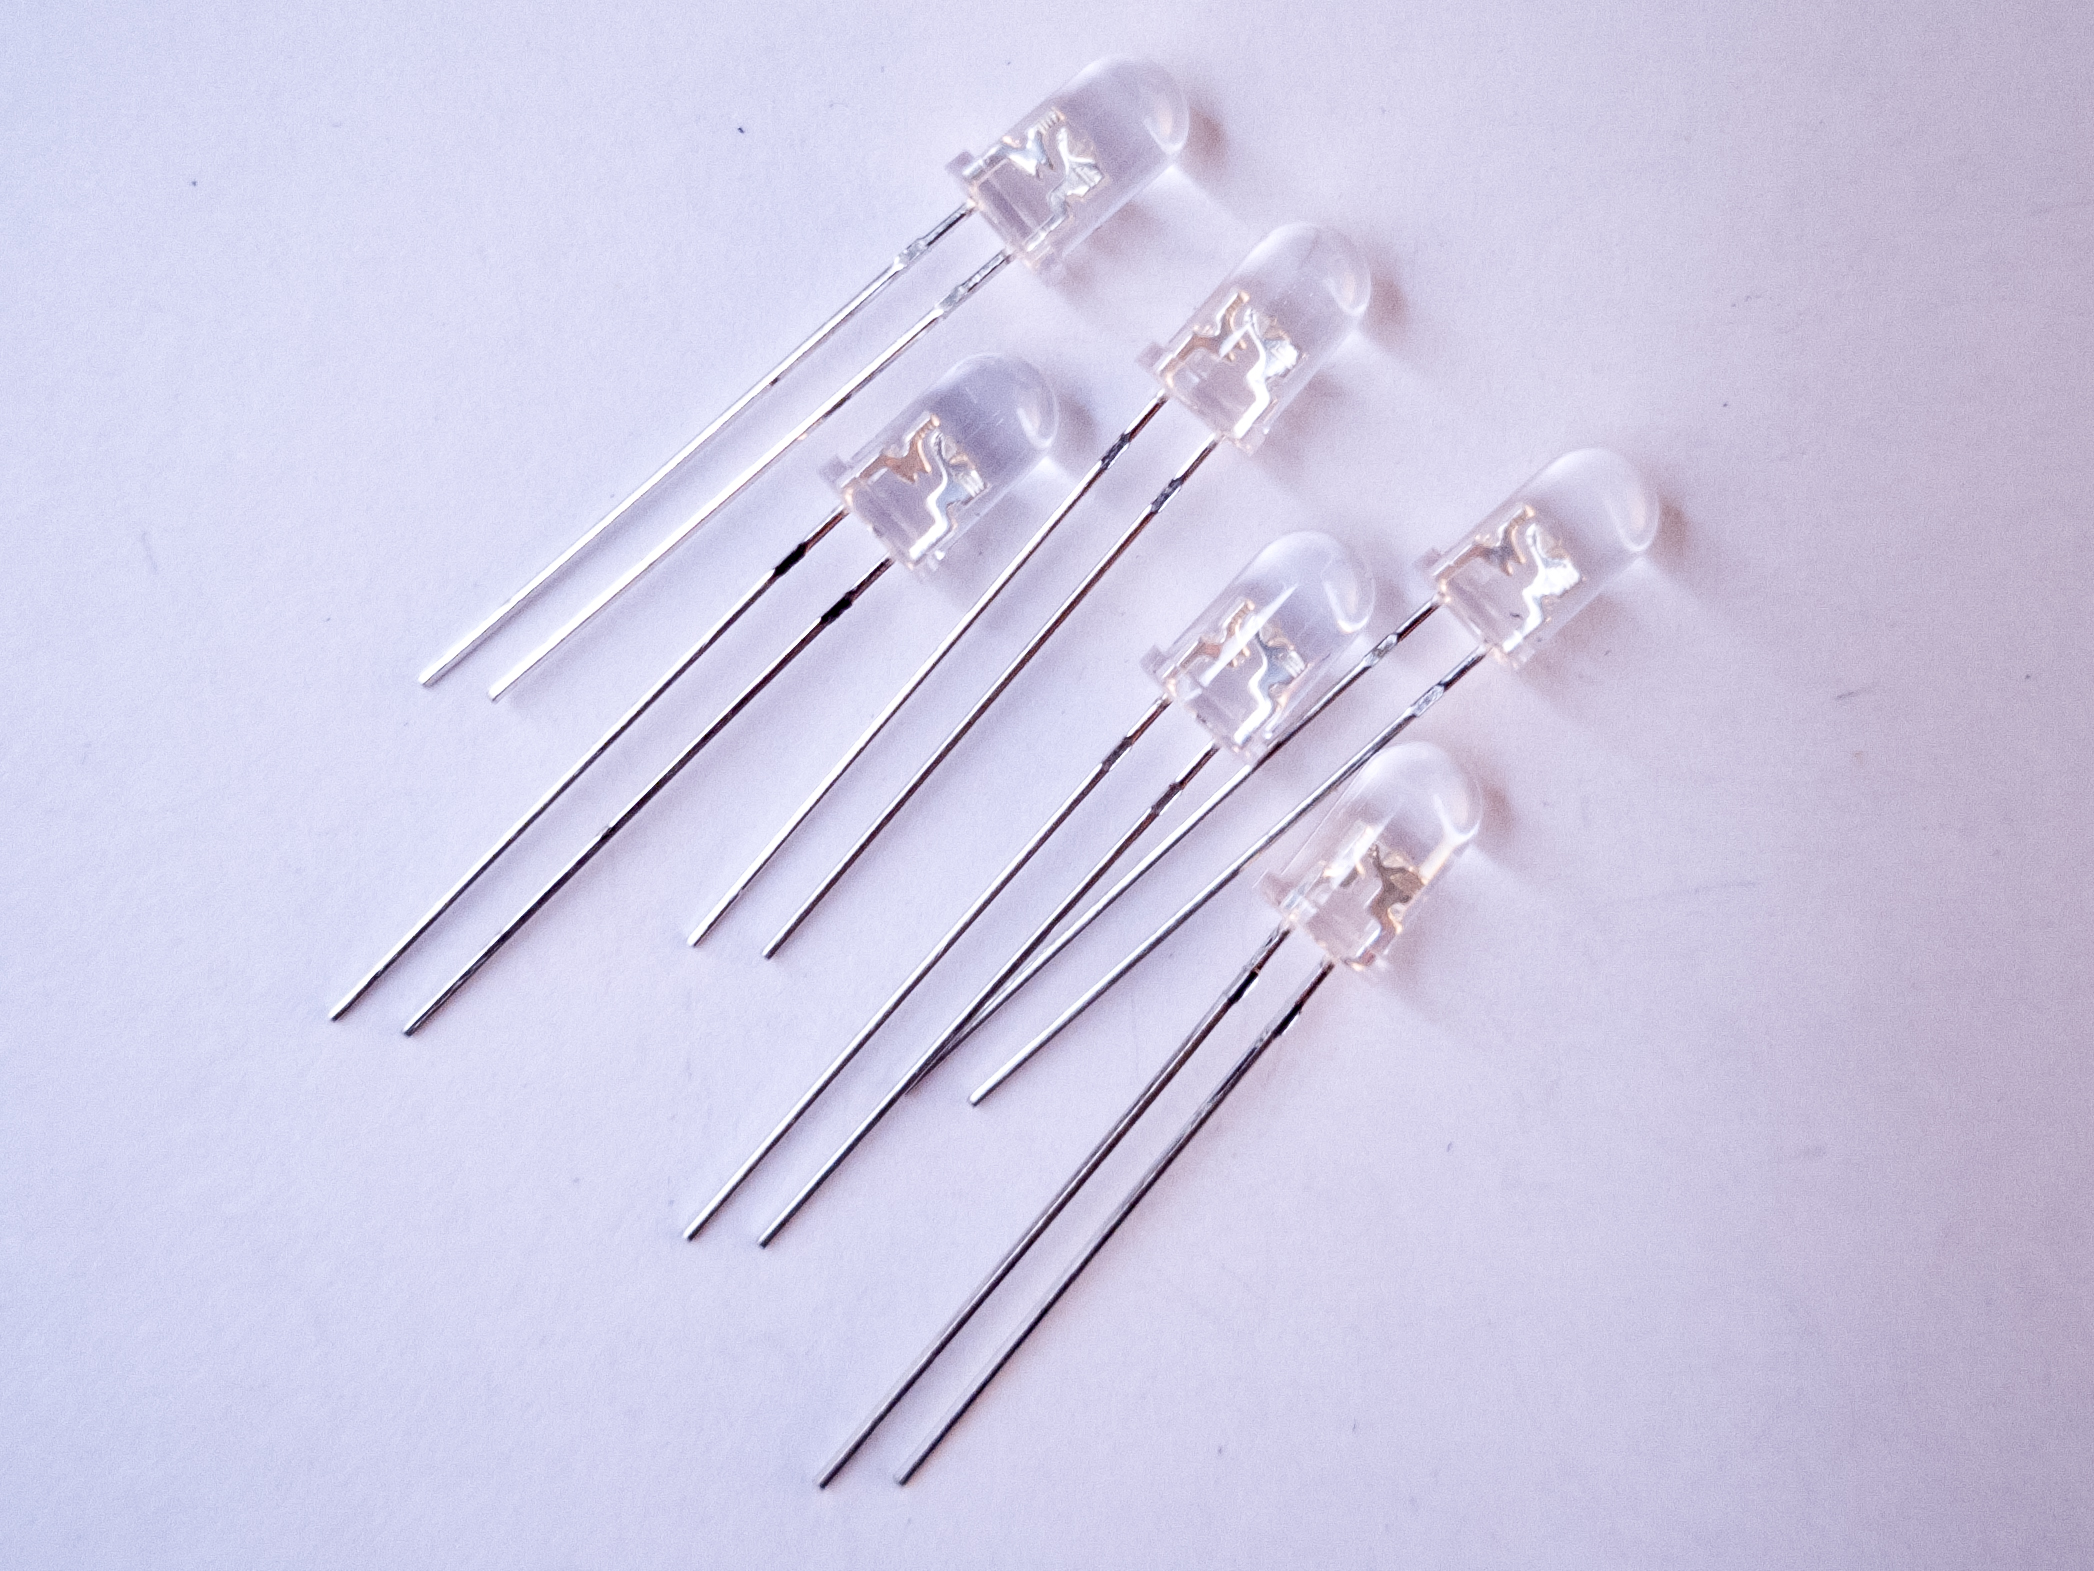
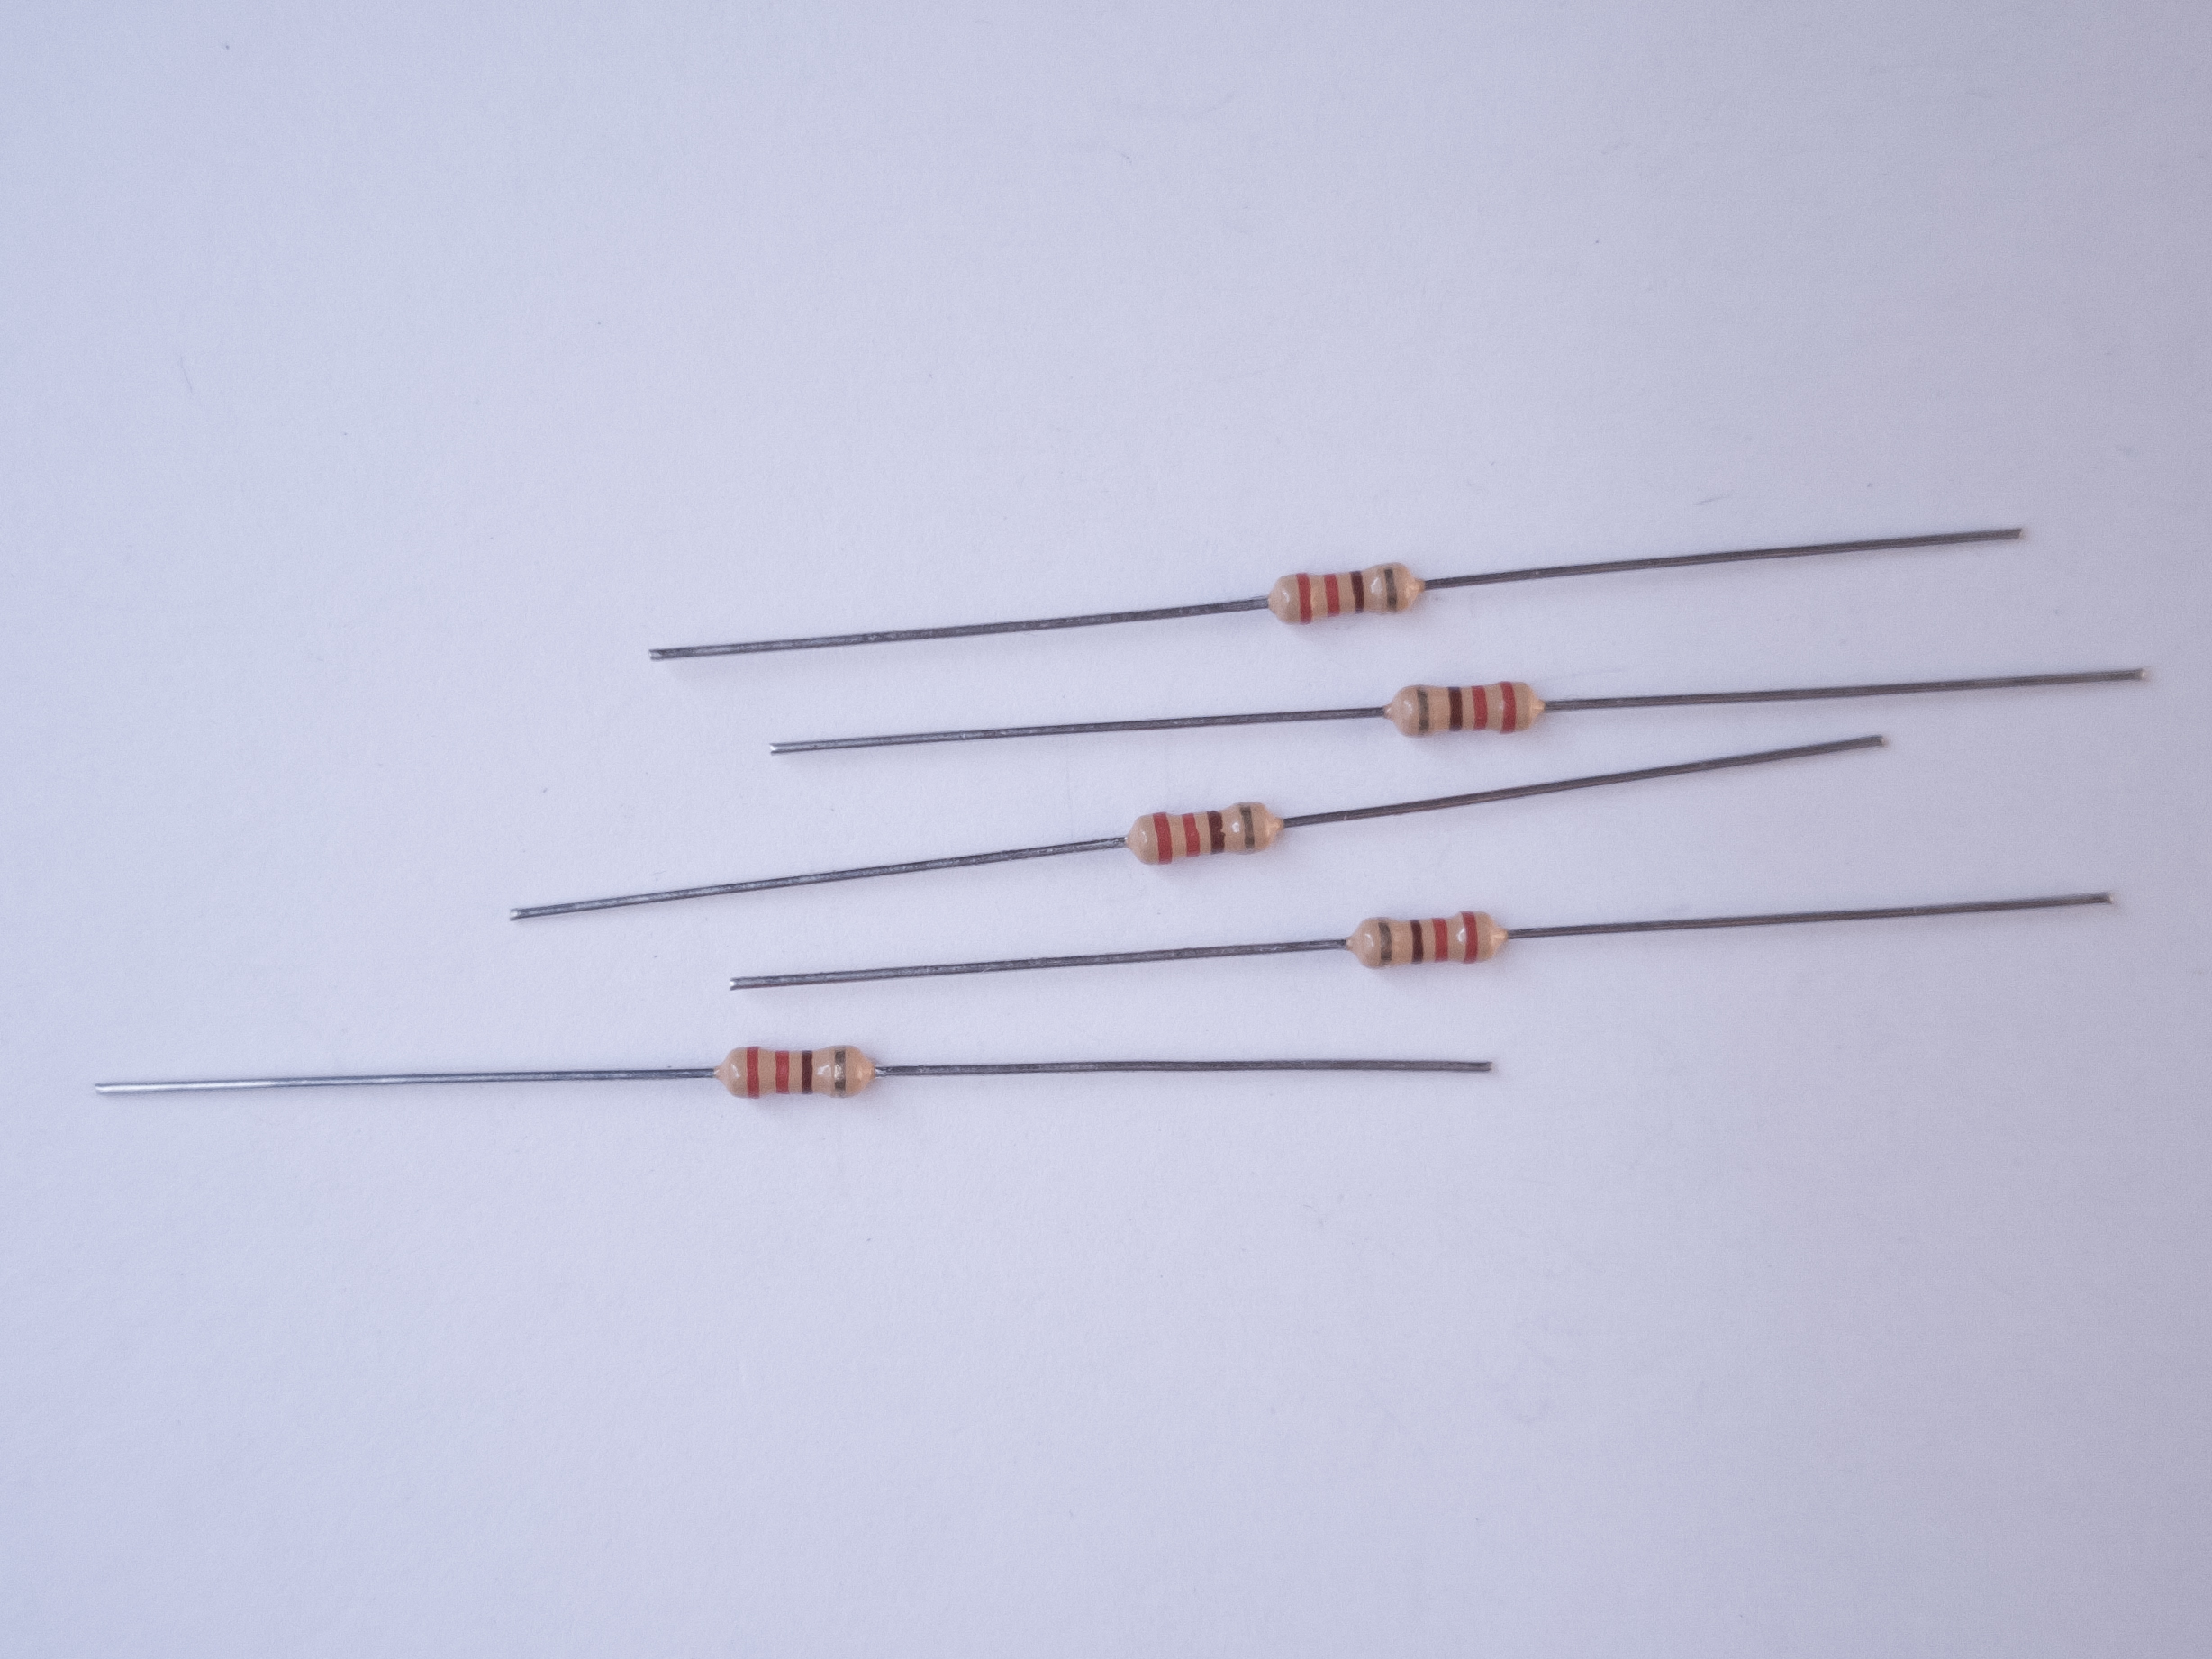
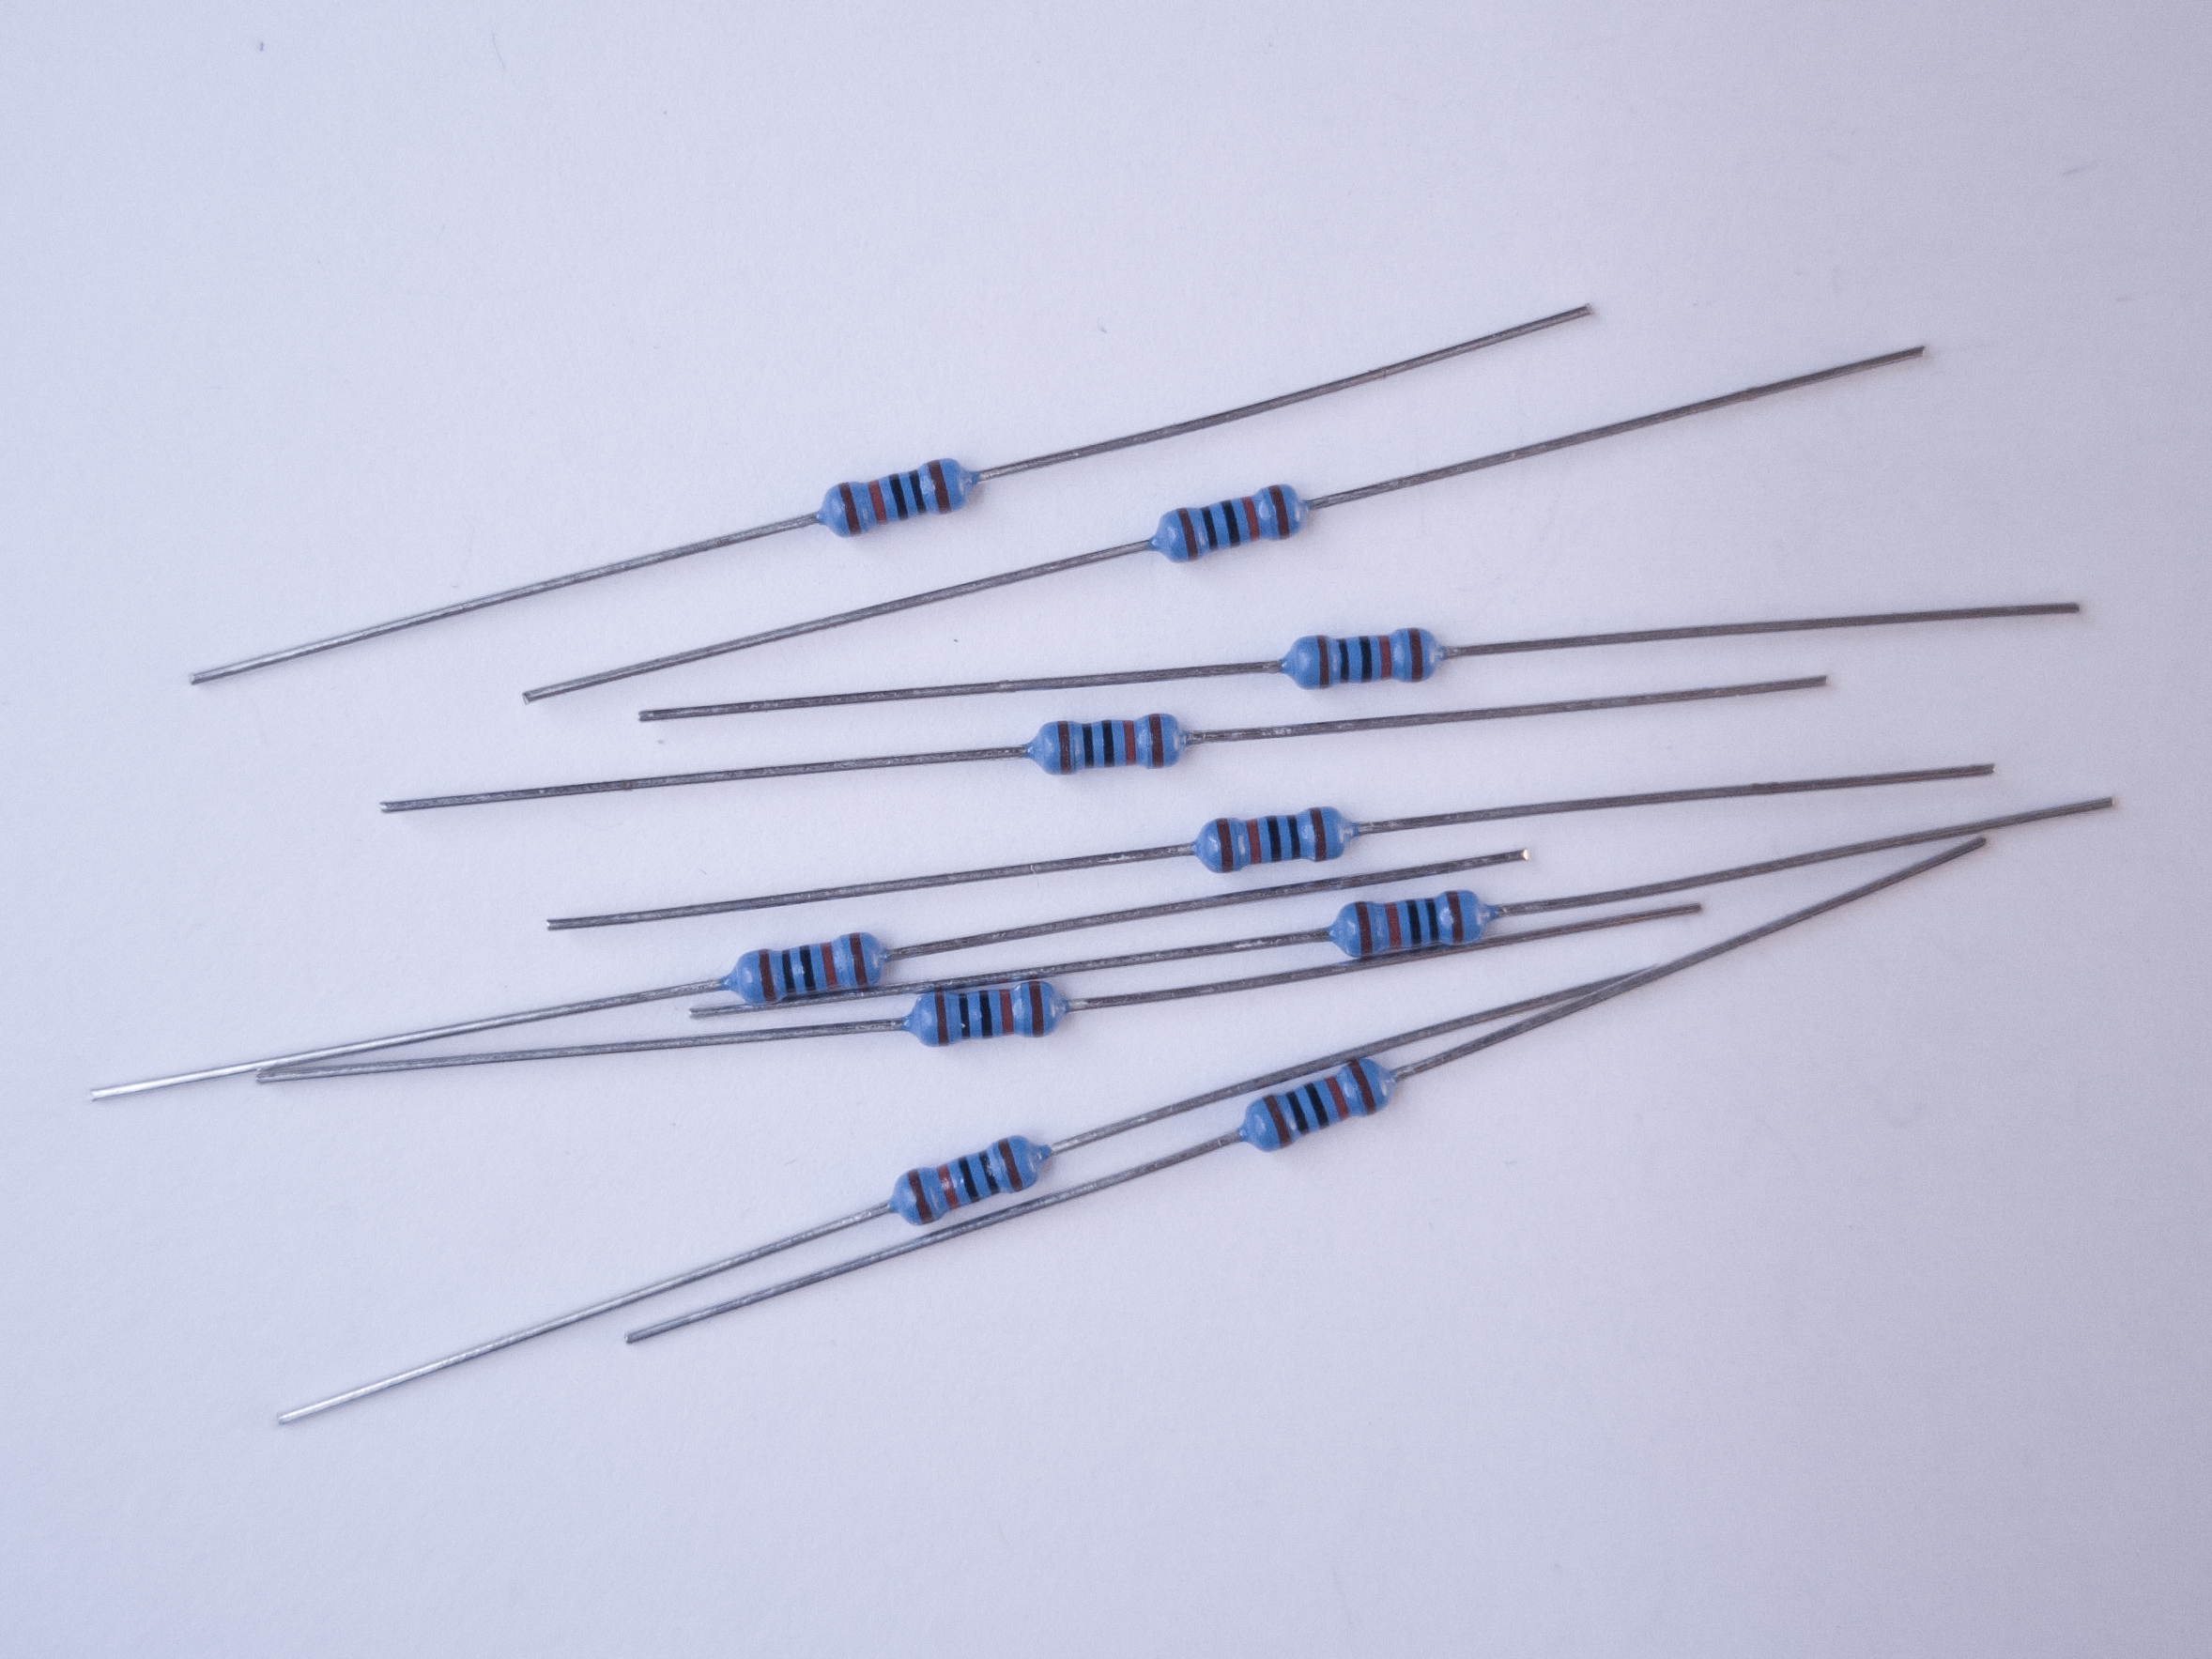
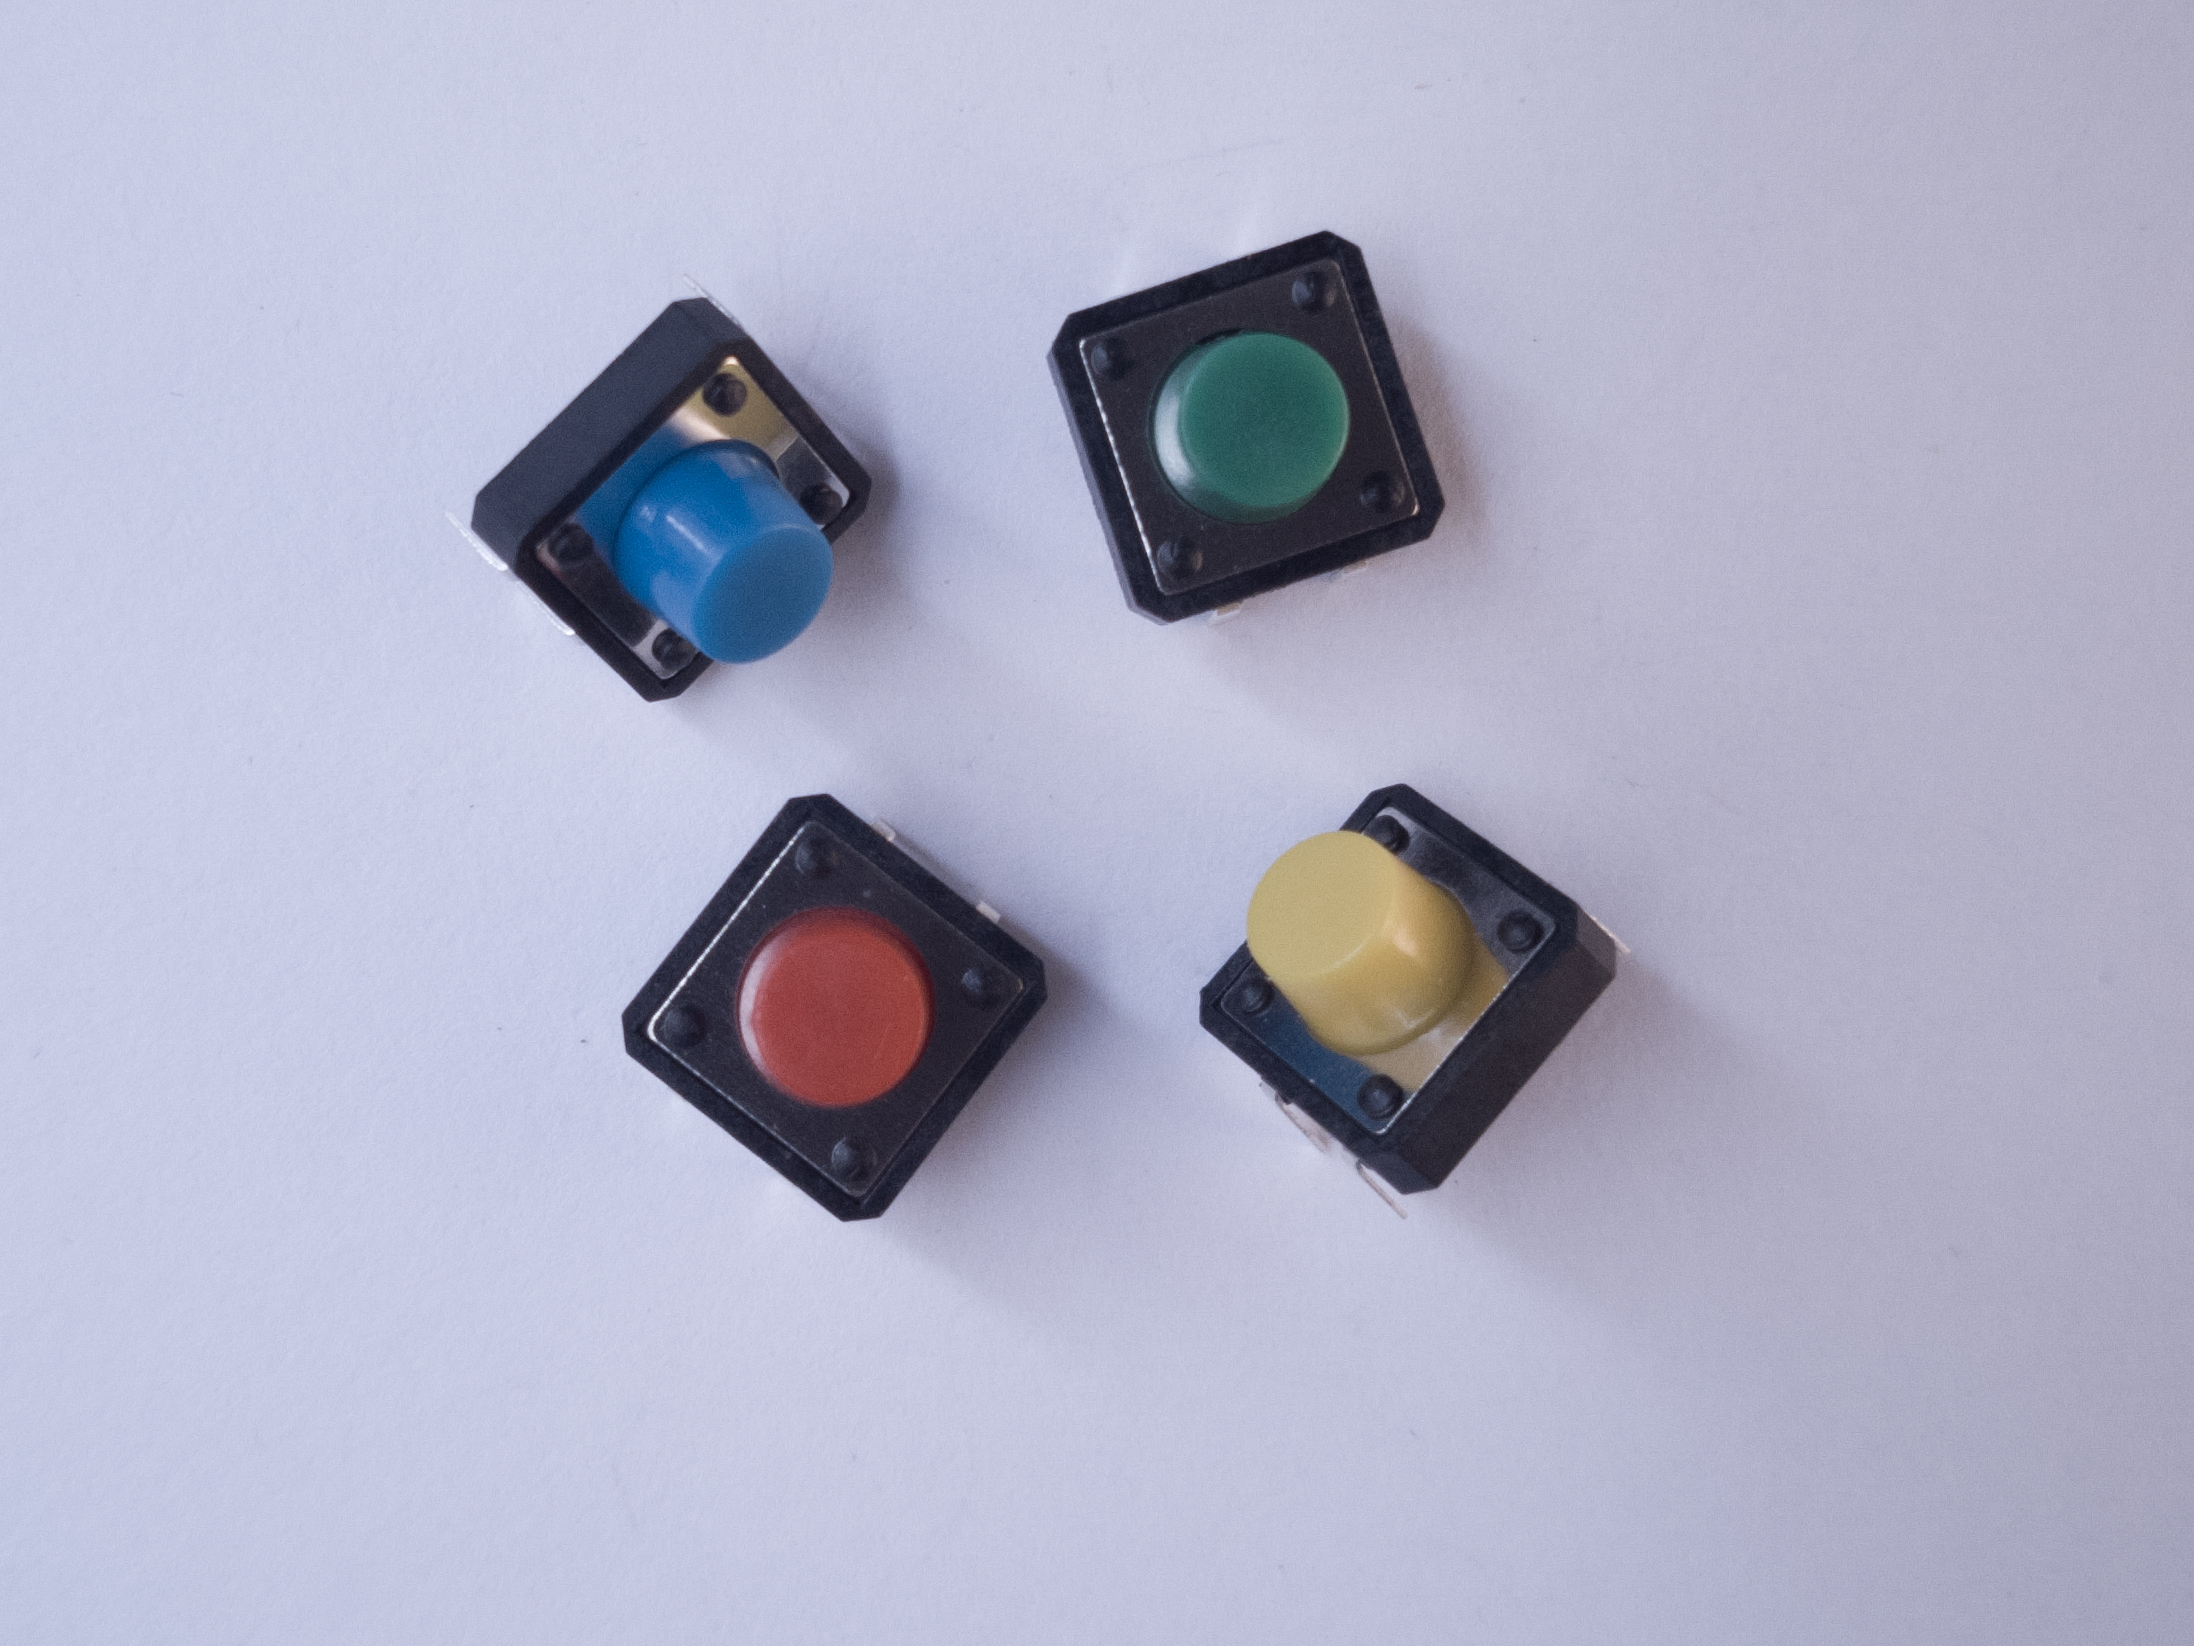
Figures 1-12 show the parts you’ll need for this exercise. Click on any image for a larger view.
Set Up the Breadboard
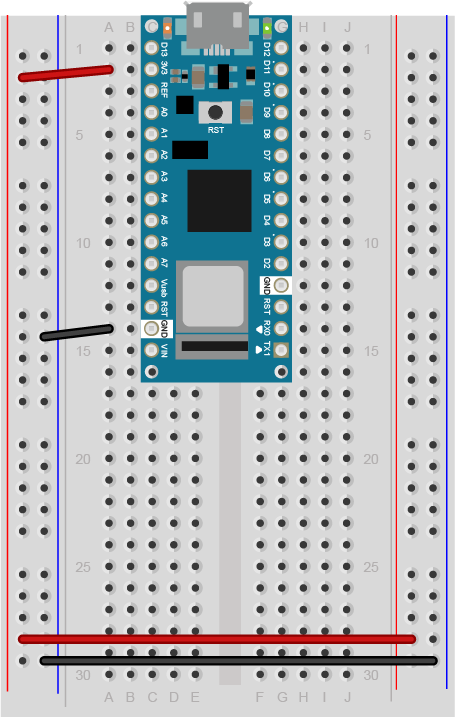
Connect power and ground on the breadboard to power and ground from the microcontroller. On the Arduino module, use the 5V or 3.3V (depending on your model) and any of the ground connections. Figures 13 and 14 show how to do this for an Arduino Uno and an Arduino Nano 33 IoT.
As shown in Figure 13, the Uno’s 5V output hole is connected to the red column of holes on the far left side of the breadboard. The Uno’s ground hole is connected to the blue column on the left of the board. The red and blue columns on the left of the breadboard are connected to the red and blue columns on the right side of the breadboard with red and black wires, respectively. These columns on the side of a breadboard are commonly called the buses. The red line is the voltage bus, and the black or blue line is the ground bus.
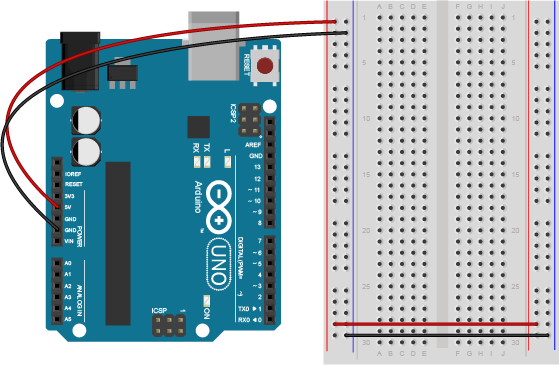
Images made with Fritzing
In Figure 14, the Nano is mounted at the top of the breadboard, straddling the center divide, with its USB connector facing up. The top pins of the Nano are in row 1 of the breadboard.
The Nano, like all Dual-Inline Package (DIP) modules, has its physical pins numbered in a U shape, from top left to bottom left, to bottom right to top right. The Nano’s 3.3V pin (physical pin 2) is connected to the left side red column of the breadboard. The Nano’s GND pin (physical pin 14) is connected to the left side black column. These columns on the side of a breadboard are commonly called the buses. The red line is the voltage bus, and the black or blue line is the ground bus. The blue columns (ground buses) are connected together at the bottom of the breadboard with a black wire. The red columns (voltage buses) are connected together at the bottom of the breadboard with a red wire.
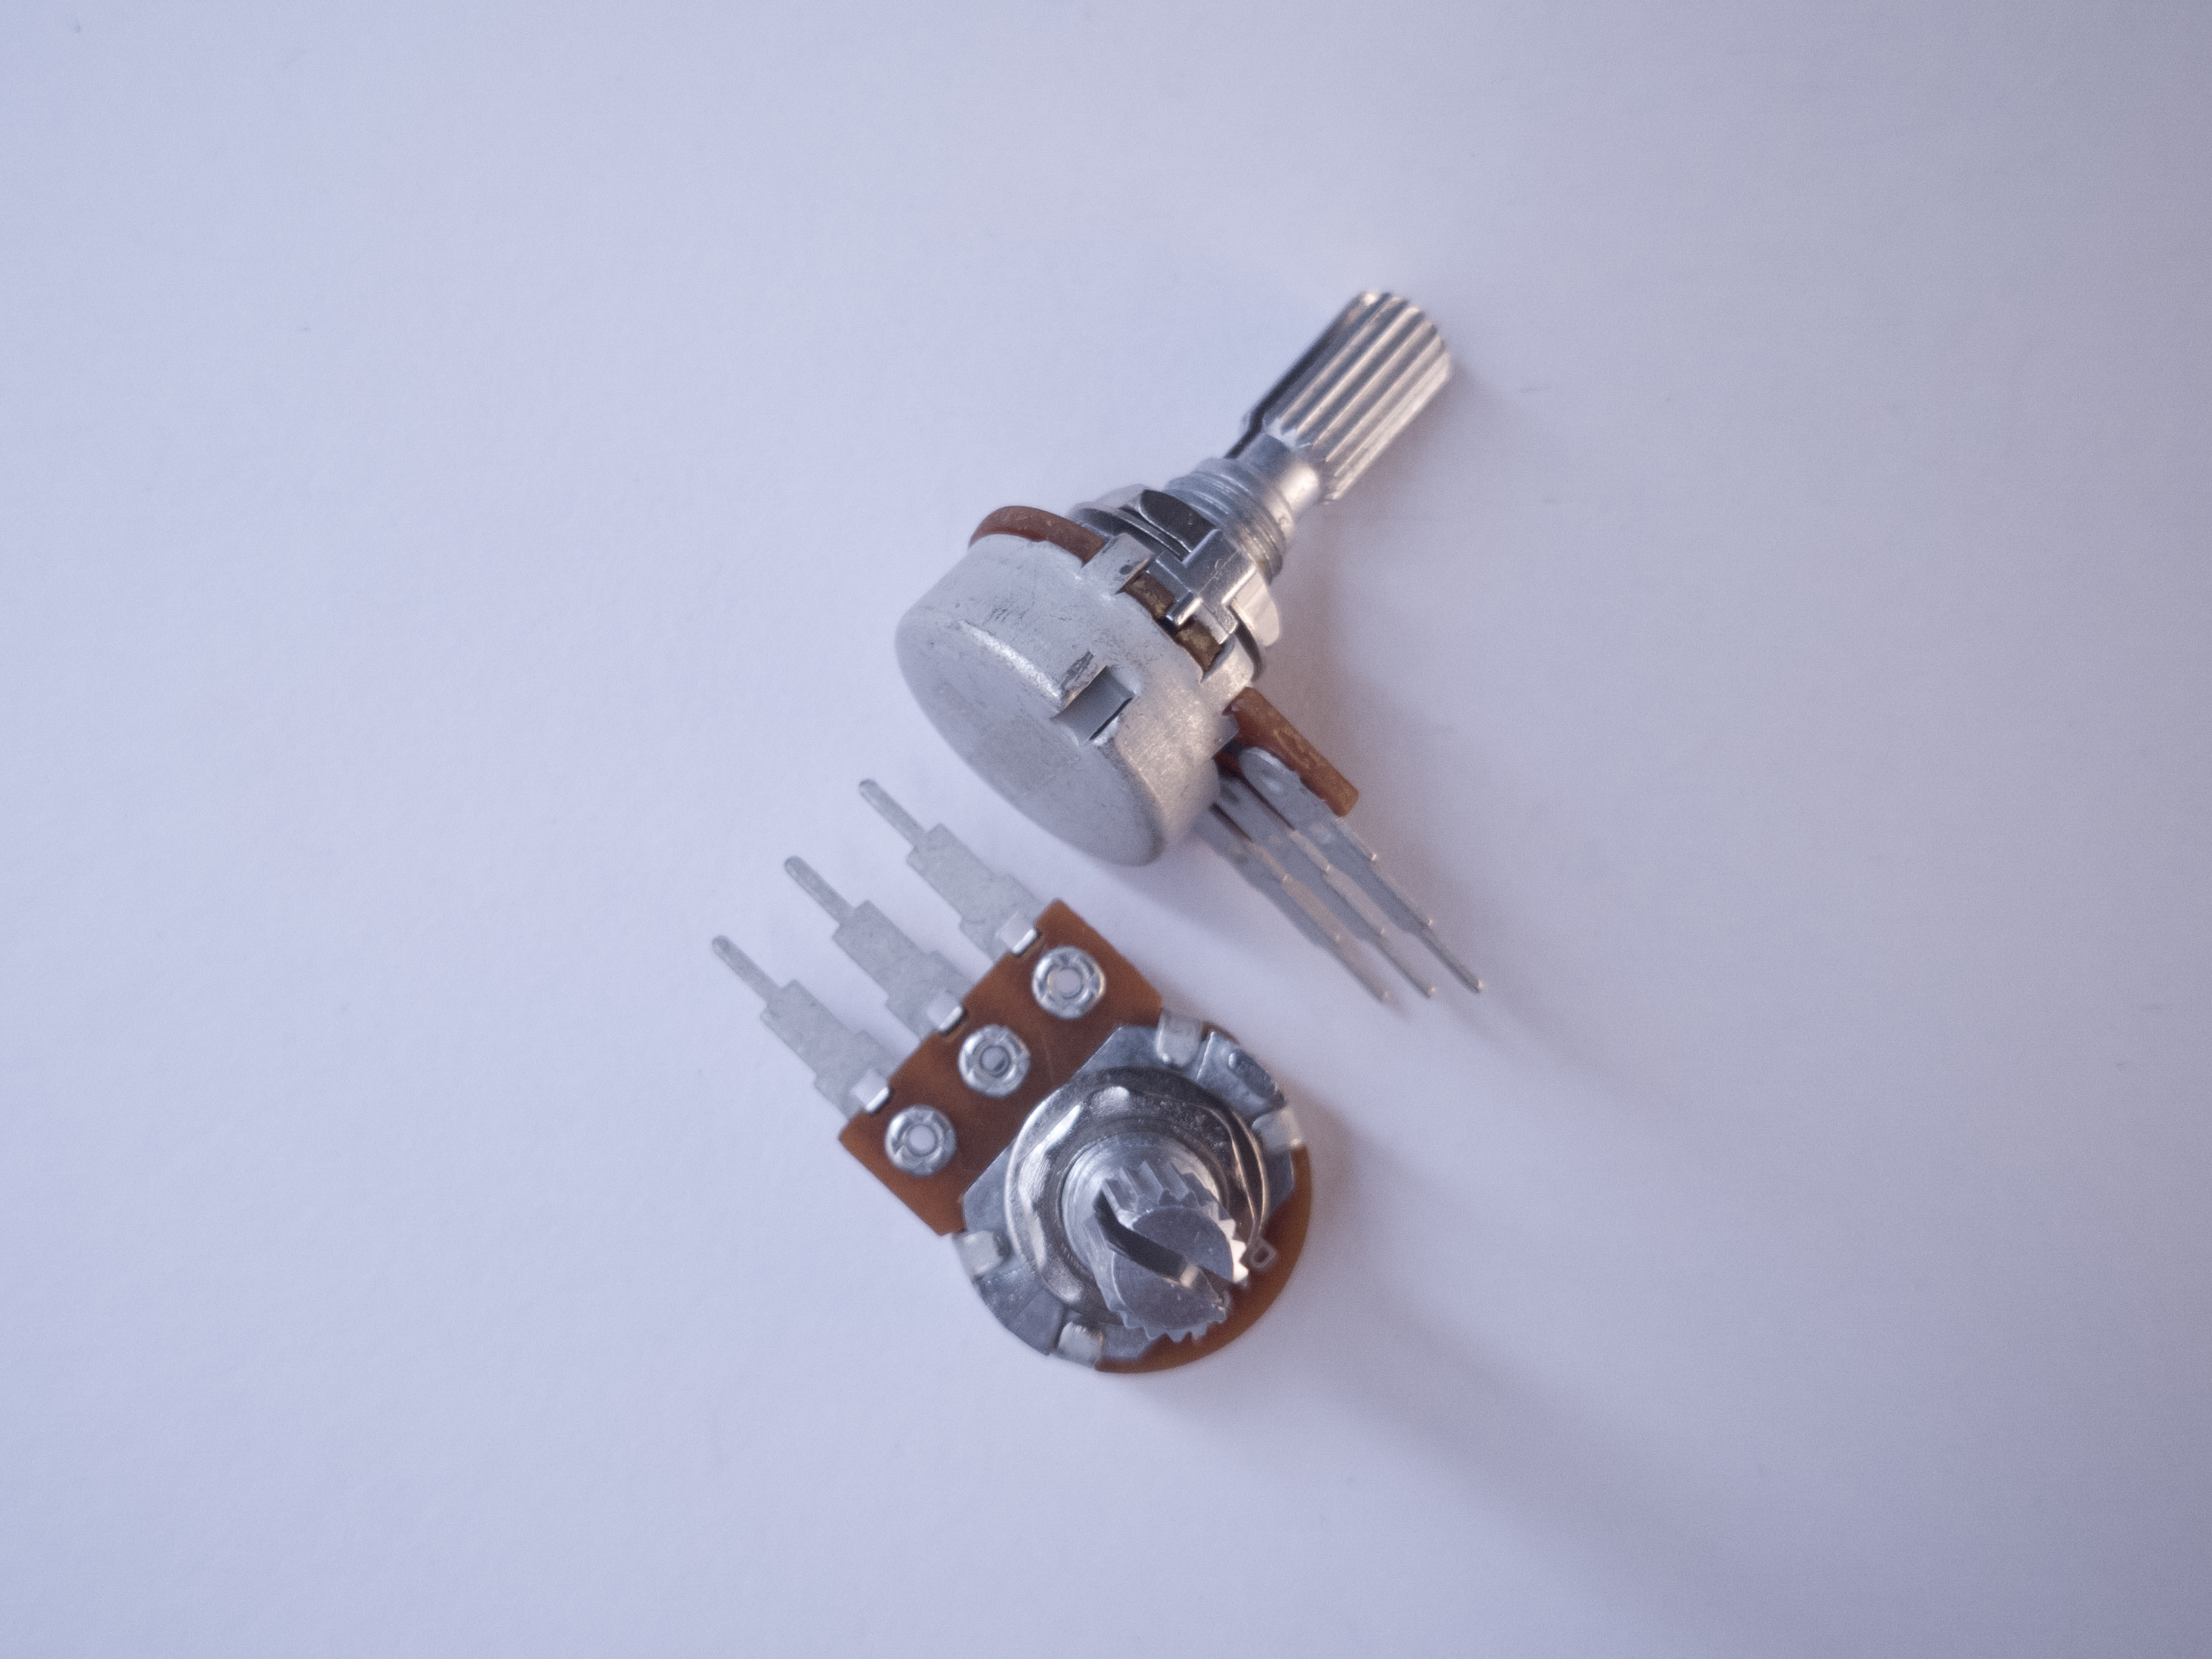
Add a Potentiometer and LED
Connect the wiper of a potentiometer to analog in pin 0 of the module and its outer connections to voltage and ground. Connect a 220-ohm resistor to digital pin 9. You can replace the LED with a speaker if you prefer audible output. Connect the anode of an LED to the other side of the resistor, and the cathode to ground as shown below. See Figure 15 and Figure 16 to learn how to do this with an Arduino Uno. Figure 17 shows a breadboard view of an Arduino Nano for the same circuit.
Related Video: Potentiometer schematic
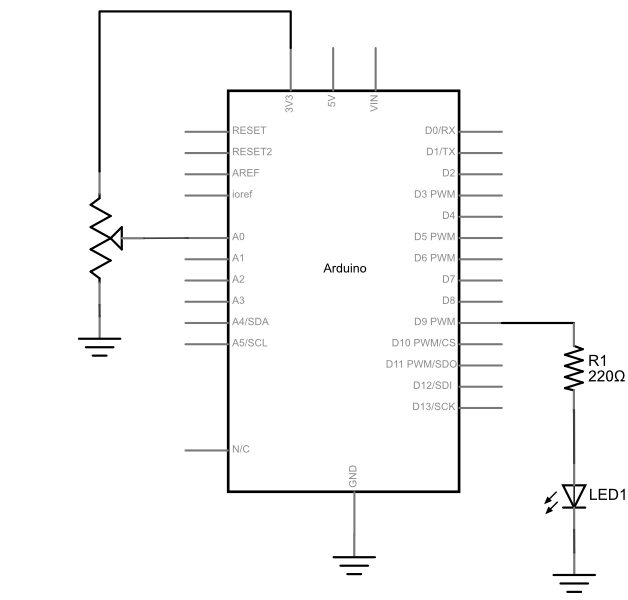
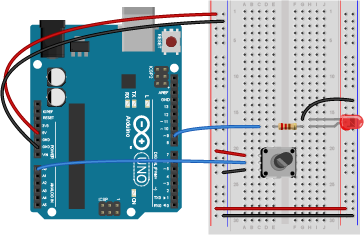
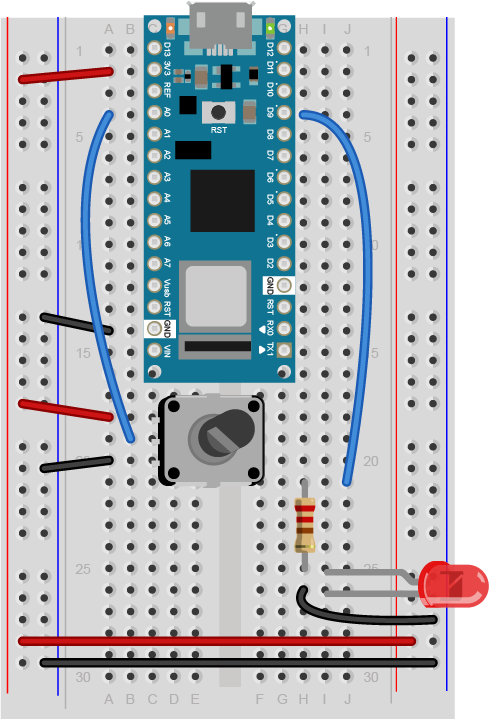
Figure 17 shows the breadboard view of an Arduino Nano connected to a potentiometer and an LED. The +3.3 volts and ground pins of the Arduino are connected by red and black wires, respectively, to the left side rows of the breadboard. +3.3 volts is connected to the left outer side row (the voltage bus) and ground is connected to the left inner side row (the ground bus). The side rows on the left are connected to the side rows on the right using red and black wires, respectively, creating a voltage bus and a ground bus on both sides of the board. The potentiometer is mounted in the left center section of the solderless breadboard. Its outside pins are connected to the voltage and ground buses, respectively There is a wire connecting to analog in 0 of the nano (physical pin 4) to the the center pin of the potentiometer. An LED is mounted in the right center section of the board, with a 220-ohm resistor attached to its anode (long leg). The other end of the resistor connects to the Nano’s digital pin 9 (physical pin 27). The cathode of the LED (short leg) connects to ground. If you’re using a speaker instead of the LED, connect it to the same connections as the LED.
Program the Module
Now that you have the board wired correctly, program your Arduino as follows:
First, establish some global variables: one to hold the value returned by the potentiometer, and another to hold the brightness value. Make a global constant to give the LED’s pin number a name.
const int ledPin = 9;       // pin that the LED is attached to
int analogValue = 0;        // value read from the pot
int brightness = 0;         // PWM pin that the LED is on.
In the setup() method, initialize serial communications at 9600 bits per second, and set the LED’s pin to be an output.
  // initialize serial communications at 9600 bps:
    Serial.begin(9600);
    // declare the led pin as an output:
    pinMode(ledPin, OUTPUT);
}
In the main loop, read the analog value using analogRead() and put the result into the variable that holds the analog value. Then divide the analog value by 4 to get it into a range from 0 to 255. Then use the analogWrite() command to face the LED. Then print out the brightness value. An alternate loop function for the speaker follows right after the first one.
void loop() {
    analogValue = analogRead(A0);    // read the pot value
    brightness = analogValue /4;       //divide by 4 to fit in a byte
    analogWrite(ledPin, brightness);   // PWM the LED with the brightness value
    Serial.println(brightness);        // print the brightness value back to the serial monitor
}
If you’re replacing the LED with a speaker, here’s an alternate loop function that will play a changing tone on the speaker:
void loop() {
    analogValue = analogRead(A0);      // read the pot value
    frequency = (analogValue /4) * 10; // divide by 4 to fit in a byte, multiply by 10 for a good tonal range
    tone(pinNumber, frequency);        // make a changing tone on the speaker
    Serial.println(brightness);        // print the brightness value back to the serial monitor
}
When you run this code, the LED should dim up and down as you turn the pot, and the brightness value should show up in the serial monitor.
Other variable resistors
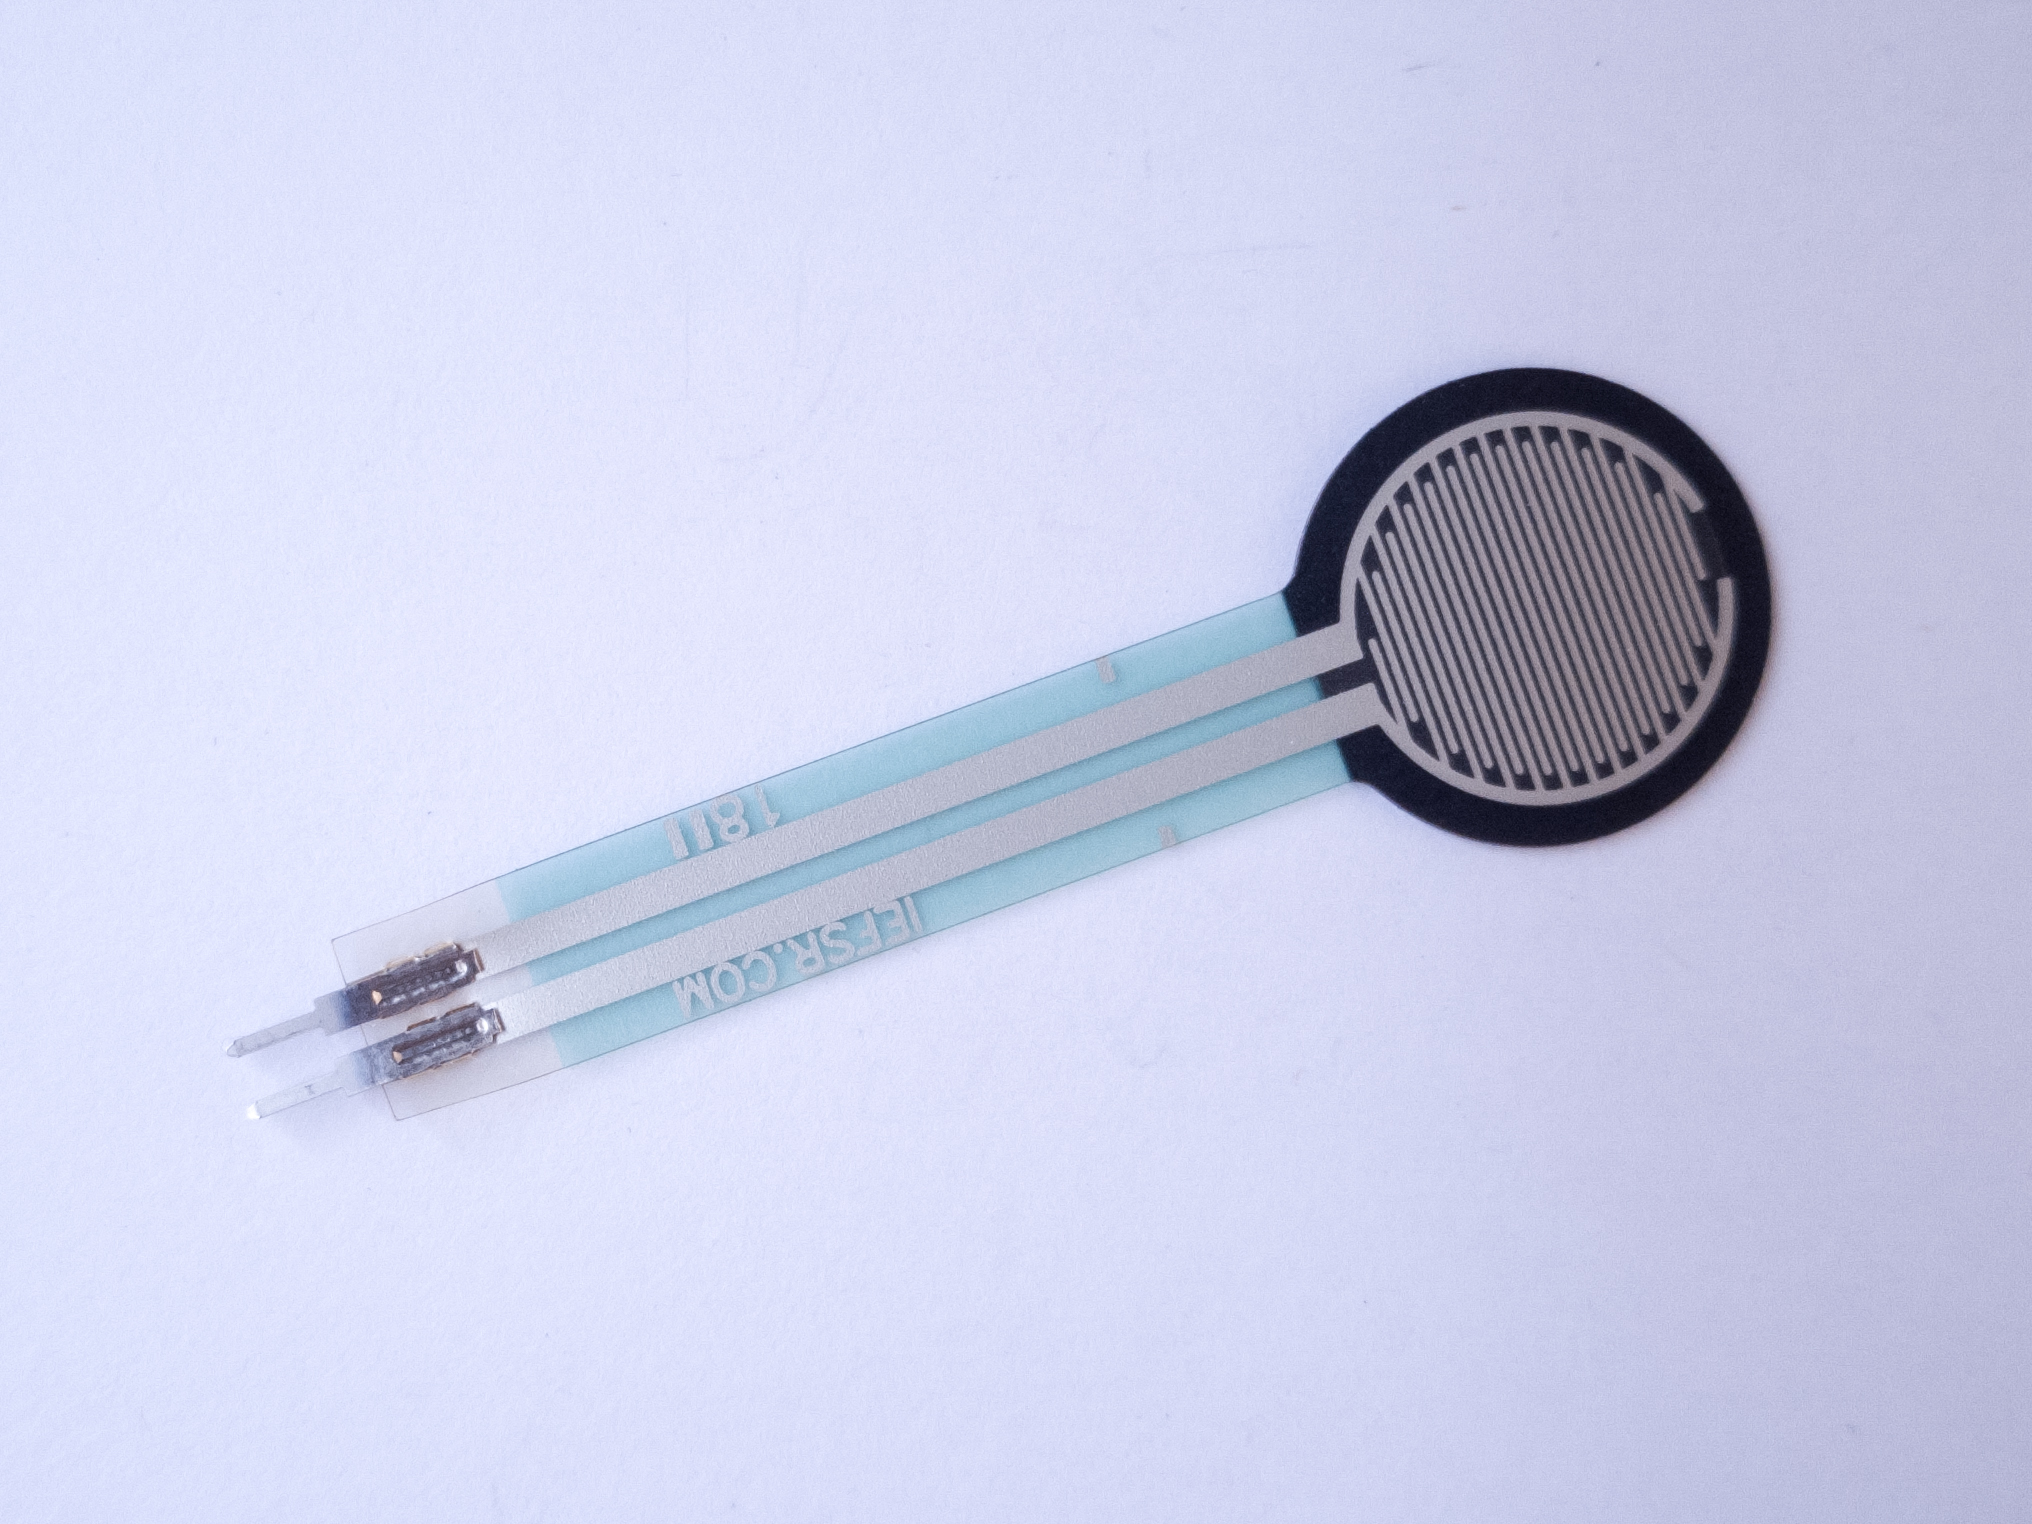
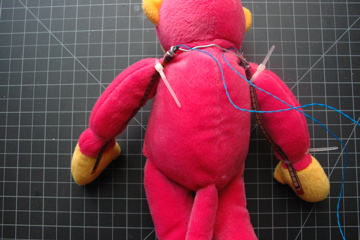
You can use many different types of variable resistors for analog input. For example, the pink monkey in the photo below has his arms wired with flex sensors. These sensors change their resistance as they are flexed. When the monkey’s arms move up and down, the values of the flex sensors change the brightness of two LEDs. The same values could be used to control servo motors, change the frequency on a speaker, or move servo motors.
Related Video: Wiring an FSR (force sensitive resistor)
Related Video: Wiring a photocell to measure light
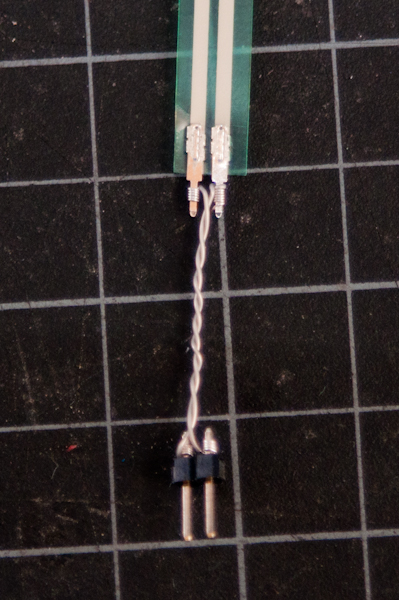
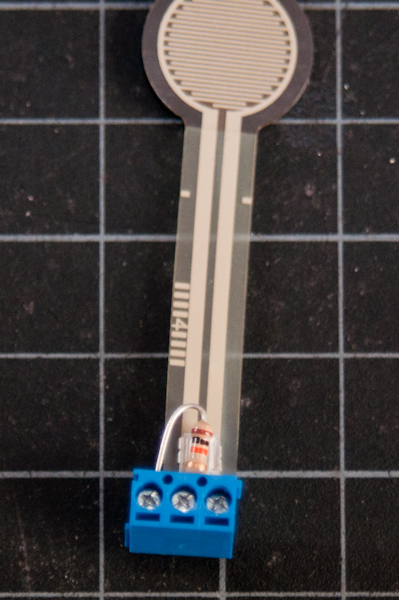
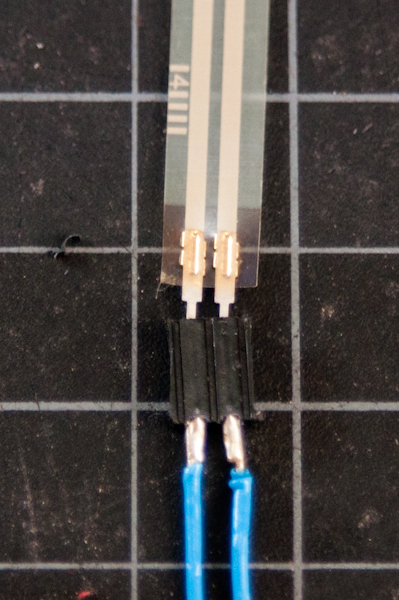
Note on Soldering Sensor Leads
Flex sensors and force-sensing resistors melt easily, so unless you are very quick with a soldering iron, it’s risky to solder directly to their leads. See Figure 19-21 to learn about three better solutions:
Adafruit has a good FSR tutorial as well.
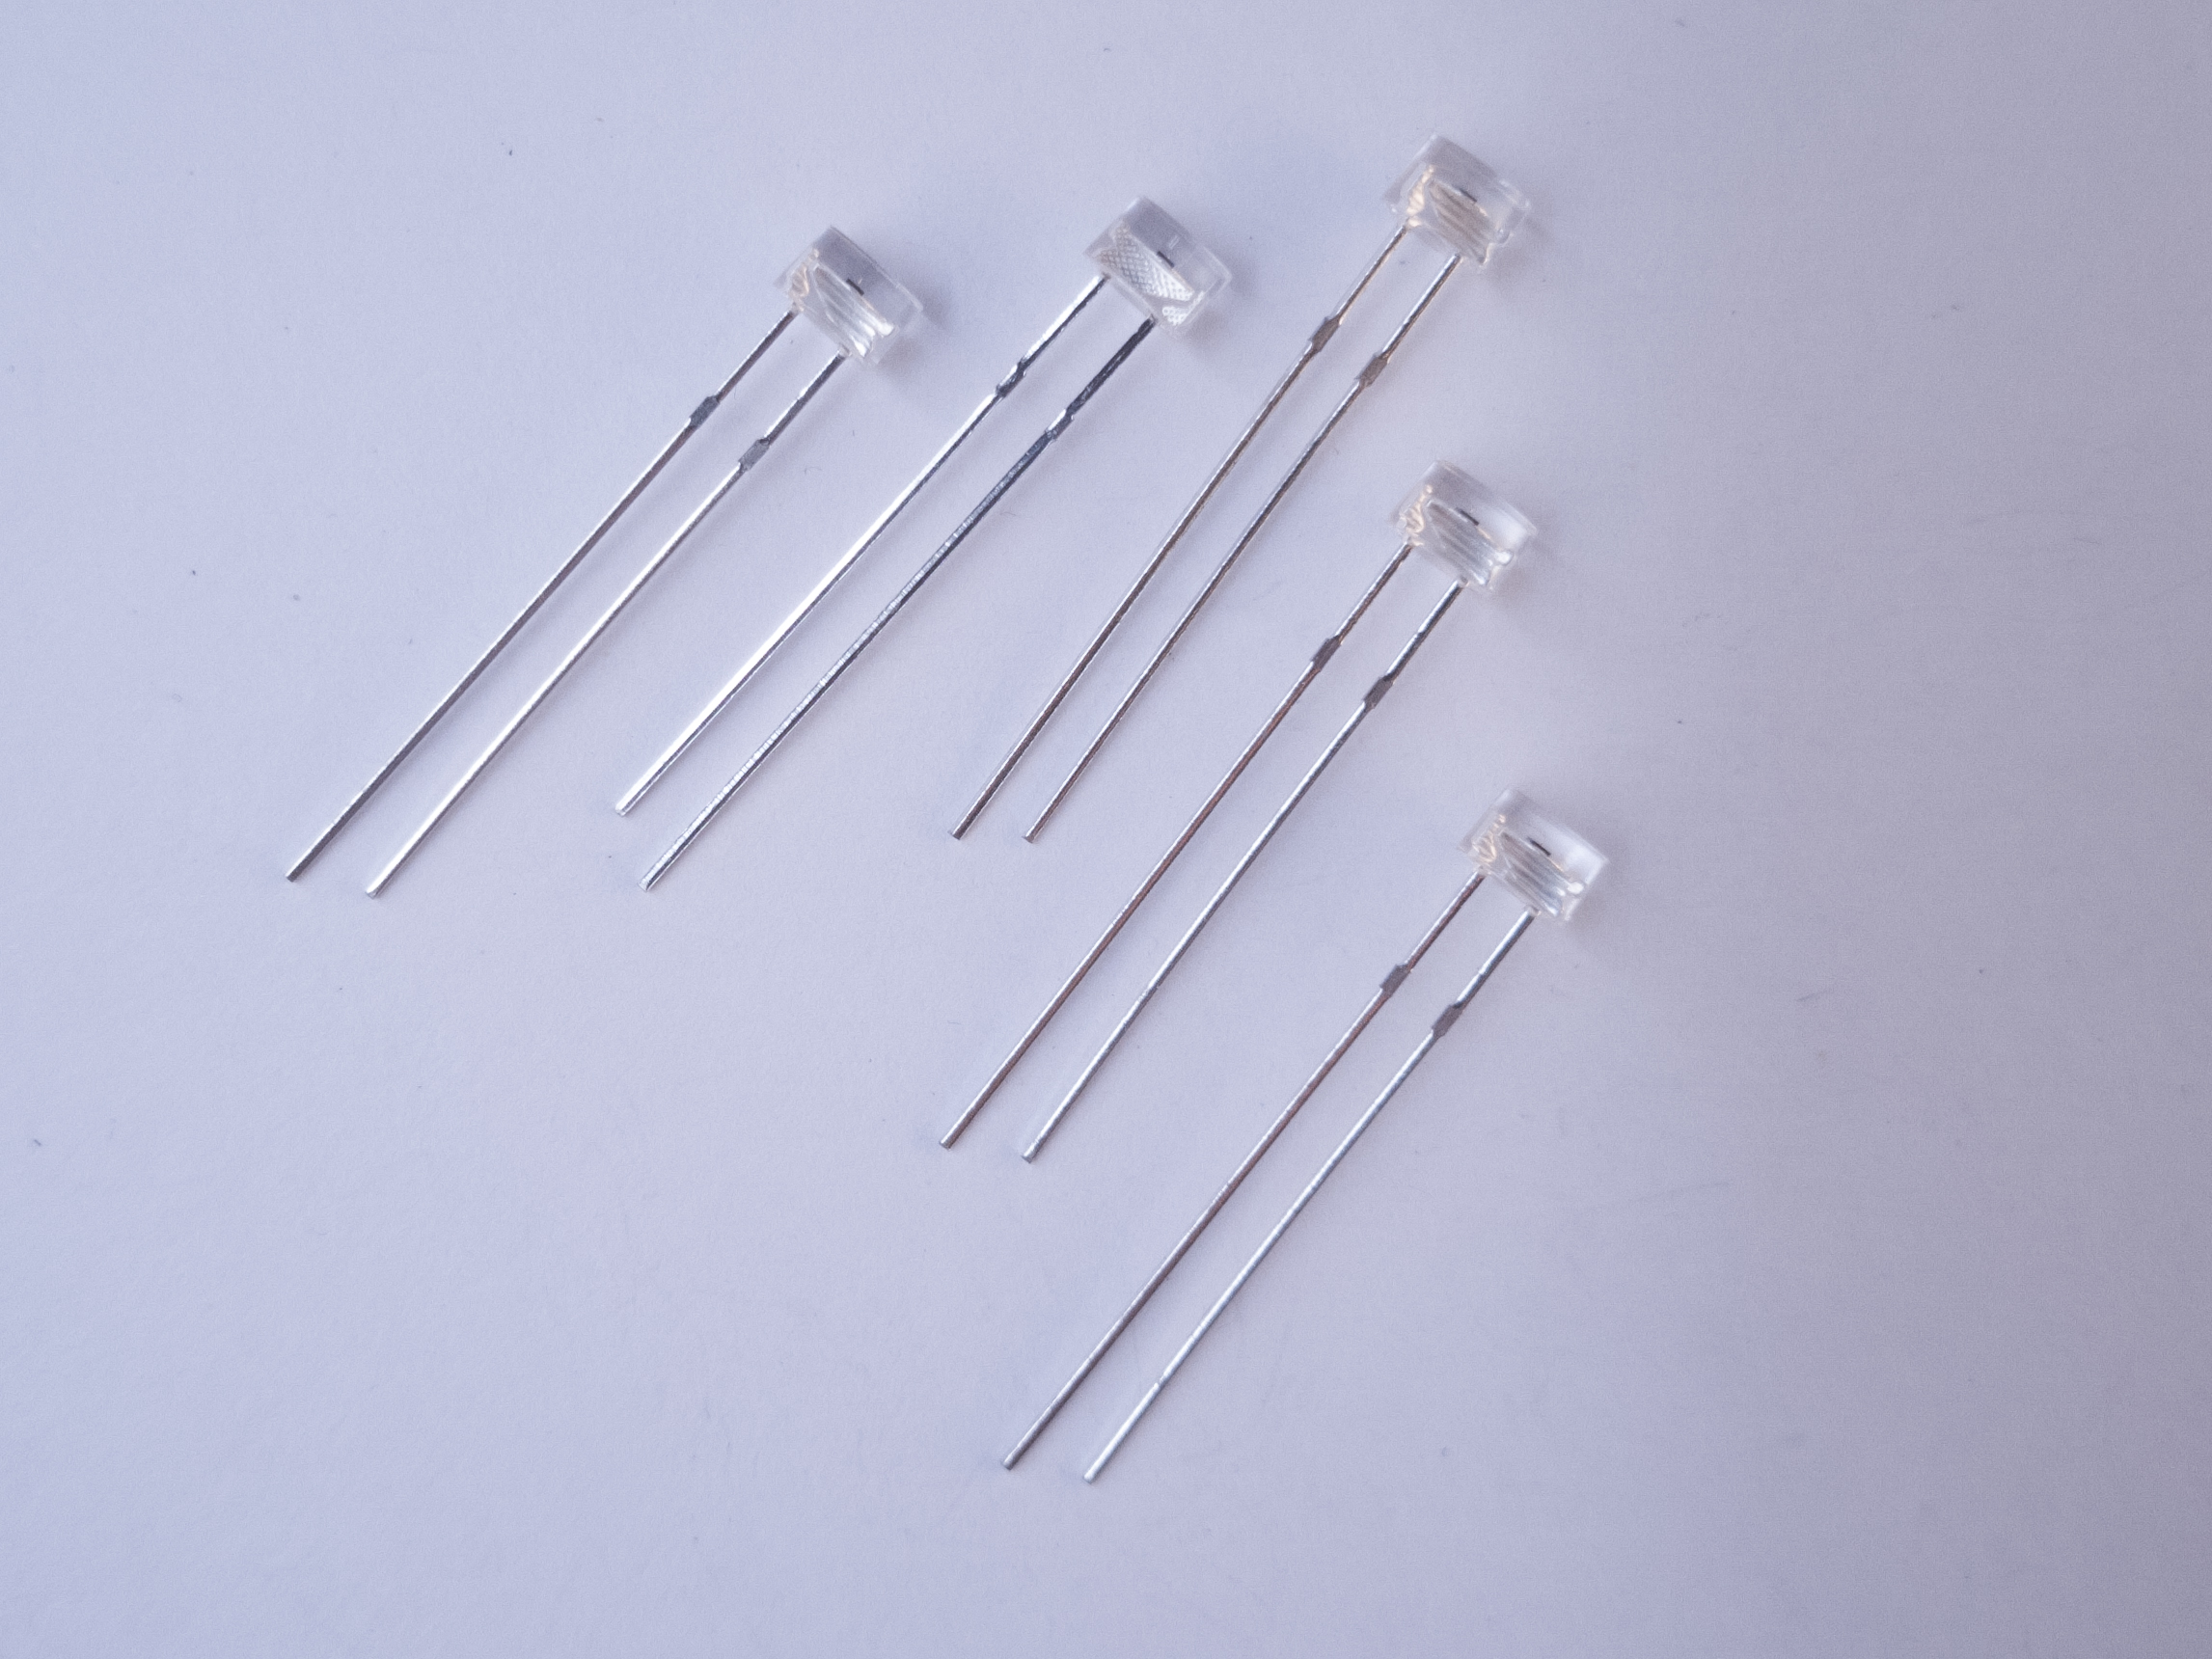
If you’d like to read a changing light level, you can use a phototransistor for the job. Phototransistors are not variable resistors like photoresistors (which are shown in this video), but they perform similarly are made from less toxic materials. They are actually transistors in which the light falling on the sensor acts as the transistor’s base. Like photoresistors, they are sensitive to changes in light, and they work well in the same voltage divider circuit. Figure 22 shows how to connect a phototransistor and a 10-kilohm resistor as an analog input:
Different phototransistors will have different sensitivities to light. For example, this model from Everlight, which has a clear top, is most sensitive to 390 – 700 nm light range, with a peak at 630nm (orange-red). This model from Excelitas has a colored top to block IR light, and has a range from 450 -700nm, with a peak at 585nm (yellow). For the frequencies of the visible light spectrum, see this chart from Wikipedia.
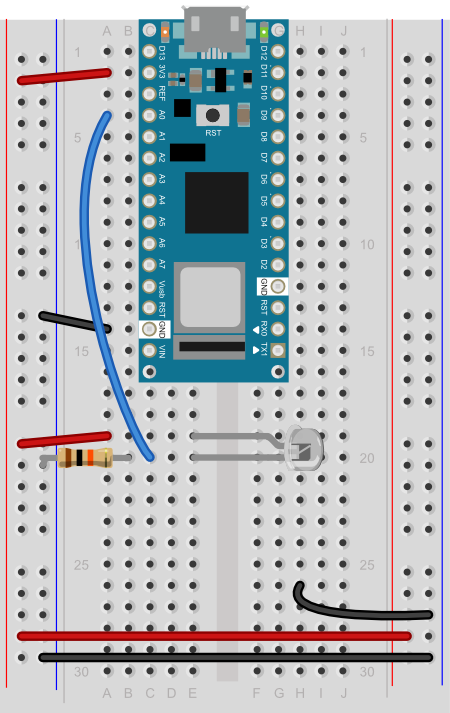
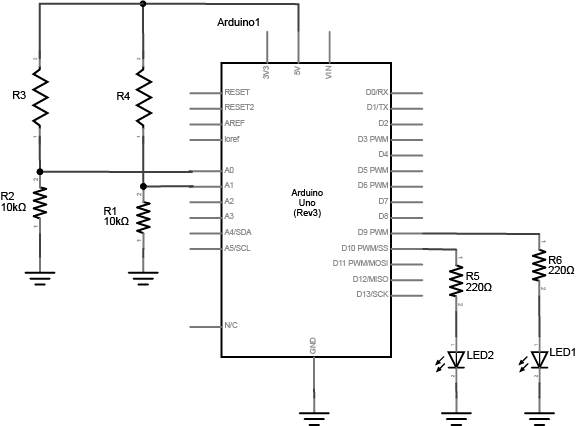
Figure 23 and 24 shows an example circuit much like the pink monkey circuit (Figure 18) above, but with force-sensing resistors instead of flex sensors.
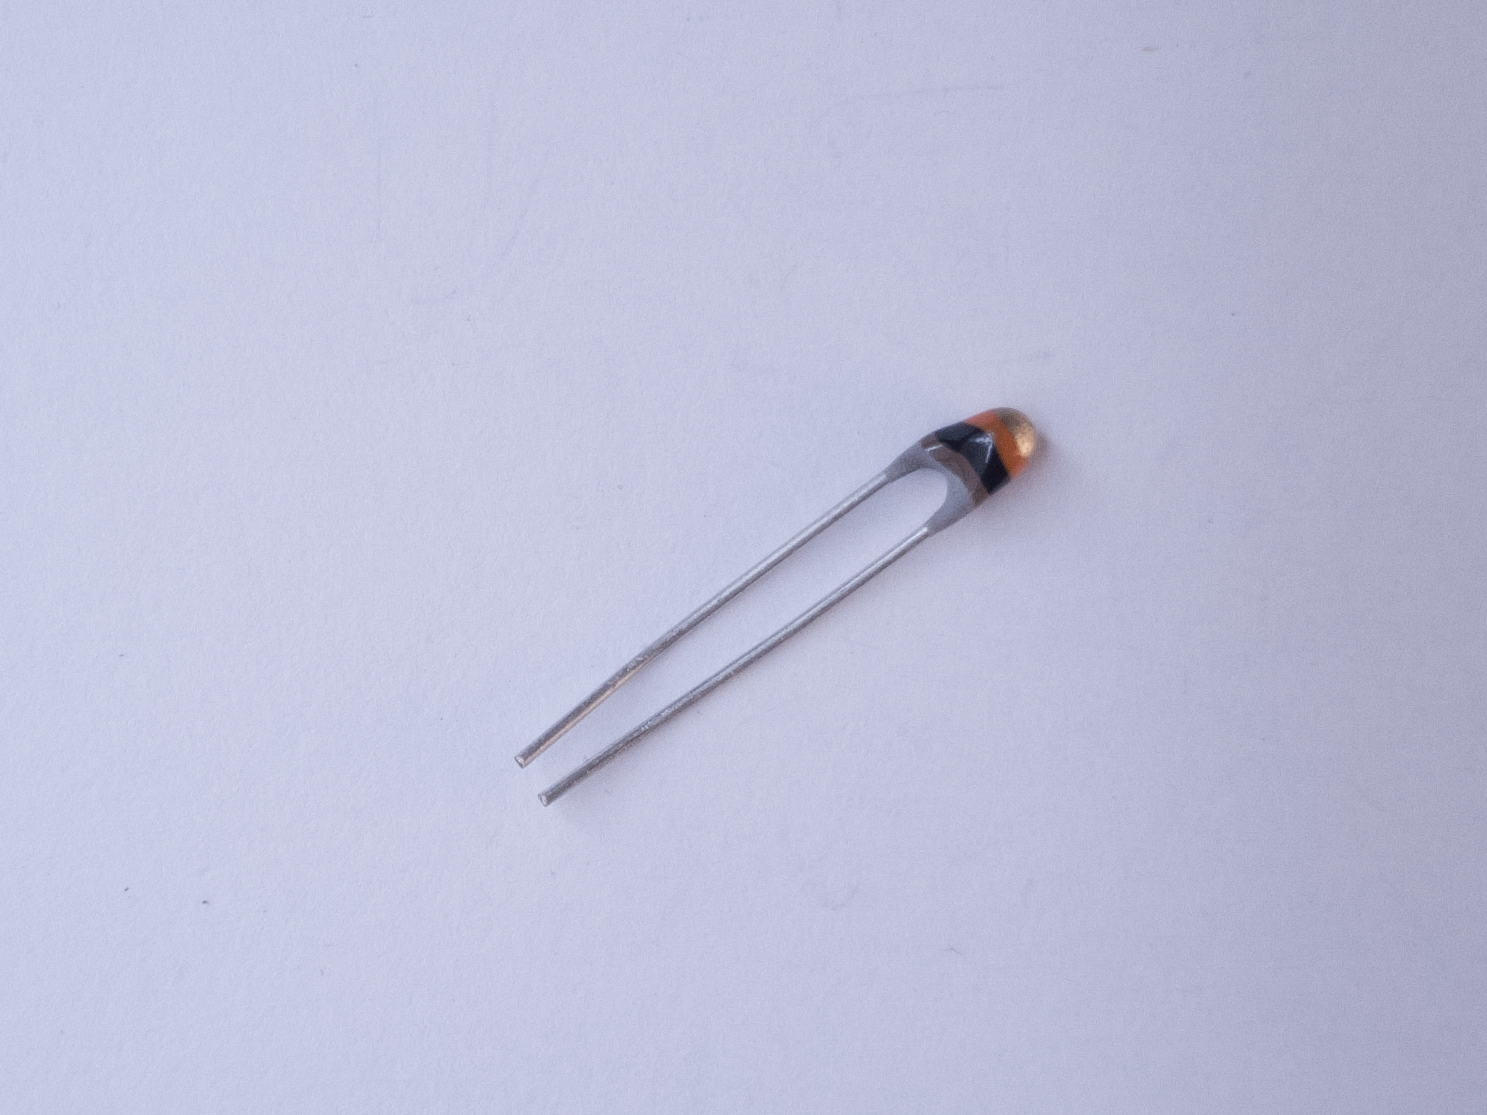
On the breadboard, two force-sensing resistors are mounted in rows 16 and 17 and 24 and 25, respectively, in the left center section of the board. Two red wires connects rows 16 and 24 in the left center section to the voltage bus on the left side. Two 10-kilohm resistors (orange, black, brown, and gold bands) connect rows 17 and 25 to the ground bus on the left hand side. Two blue wires connect from rows 17 and 25 to analog in pins 0 and 1 of the Arduino, respectively. Two 220-ohm resistors straddle the center divide of the breadboard, connecting to row 7 on both sides and 11 on both sides, respectively. In the left center section of the breadboard, two blue wires connect rows 7 and 11 to pins D10 and D9 of the Arduino, respectively. In the right center section, the anodes of two LEDs are connected to rows 7 and 11, respectively. The cathodes of the LED are in rows 6 and 10, respectively. Two black wire connects row 6 and 10 to the ground bus on the right side of the board.

The circuit above works for any variable resistor. You could replace the force-sensing resistors with flex sensors to use the monkey toy above with this circuit. Two resistors placed in series like this are called a voltage divider. There are two voltage dividers in the circuit shown, one on analog in 0 and one on analog in 1. The fixed resistor in each circuit should have the same order of magnitude as the variable resistor’s range. For example, if you’re using a flex sensor with a range of 50 – 100 kilohms, you might use a 47-kilohm or a 100-kilohm fixed resistor. If you’re using a force sensing resistor that goes from infinity ohms to 10 ohms, but most of its range is between 10 kilohms and 10 ohms, you might use a 10-kilohm fixed resistor.
The code above assumed you were using a potentiometer, which always gives the full range of analog input, which is 0 to 1023. Dividing by 4 gives you a range of 0 to 255, which is the full output range of the analogWrite() command. The voltage divider circuit, on the other hand, can’t give you the full range. The fixed resistor in the circuit limits the range. You’ll need to modify the code or the resistor if you want a different range.
Finding Your Sensor Range
Related Video: Use map() to detect the sensor’s state
The range of an analog sensor depends on both its electrical properties and its physical setting. Sometimes two sensors of the same type will give a different range, perhaps because they’re mounted differently, or because you’re activating them differently.
For example, the force sensing resistors above will perform differently when you press on them on a hard surface than when you use a soft surface under them. They’ll perform differently again when you pick them up and pinch them. Similarly, light sensors’ performance depends both on your actions and on changes in the ambient light. Two light sensors relatively near each other might have a different range if the light hits them both differently.
As a result, whenever you work with an analog sensor, you should wire it up, mount it physically in a way that you intend it to be used, then write a test program to find its range. Here’s how:
To find out your range, mount your sensor how you intend to use it, then write the simplest analog input program to test the range:
void loop() {
  // read the sensor on analog pin 0:
  int sensorValue = analogRead(A0);
  // print out the value you read:
  Serial.println(sensorValue);
}
Open the serial monitor and watch the printout as you press the FSR or flex the flex sensor. Note the maximum value and the minimum value. Then you can map the range that the sensor actually gives as input to the range that the LED needs as output.
For example, if your photocell gives a range from 400 to 900, you’d do this:
// map the sensor value from the input range (400 - 900, for example) to the output range (0-255):
int brightness = map(sensorValue, 400, 900, 0, 255);
analogWrite(ledPin, brightness);
You can also constrain the values if you find that the range is sometimes going higher or lower than you expected, like so:
// constrain the sensor value in case the raw values go
// below 400 or above 900:
sensorValue = constrain(sensorValue, 400, 900);
// then map the sensor value from the input range (400 - 900, for example) to the output range (0-255):
int brightness = map(sensorValue, 400, 900, 0, 255);
analogWrite(ledPin, brightness);
Here’s another example: you know that the maximum input range of any analog input is from 0 to 5 volts (or 3.3 volts with a Nano 33 IoT). So if you wanted to know the voltage on an analog input pin at any point, you could do some math to extrapolate it in your loop() like so:
void loop() {
  // read the sensor on analog pin 0:
  int sensorValue = analogRead(A0);
  // Convert the analog reading (which goes from 0 - 1023) to a voltage (0 - 5V):
  float voltage = sensorValue * (5.0 / 1023.0);
  // for 0-3.3V use the line below:
  // voltage = sensorValue * (3.3 / 1023.0);
  // print out the value you read:
  Serial.println(voltage);
}
Now write a sketch to control the red LED with the first sensor (we’ll call it the right hand sensor) and the green LED with the second sensor (we’ll call it the left hand sensor). First, make two constants for the LED pin numbers, and two variables for the left and right sensor values.
const int redLED = 10;     // pin that the red LED is on
const int greenLED = 11;   // pin that the green LED is on
int rightSensorValue = 0;  // value read from the right analog sensor
int leftSensorValue = 0;   // value read from the left analog sensor
In the setup(), initialize serial communication at 9600 bits per second, and make the LED pins outputs.
void setup() {
  // initialize serial communications at 9600 bps:
  Serial.begin(9600);
  // declare the led pins as outputs:
  pinMode(redLED, OUTPUT);
  pinMode(greenLED, OUTPUT);
}
Start the main loop by reading the right sensor using analogRead(). Map it to a range from 0 to 255. Then use analogWrite() to set the brightness of the LED from the mapped value. Print the sensor value out as well.
void loop() {
  rightSensorValue = analogRead(A0); // read the pot value
  // constrain the sensor value in case the raw values go
  // below 400 or above 900:
   rightSensorValue = constrain(rightSensorValue, 400, 900);
  // map the sensor value from the input range (400 - 900, for example)
  // to the output range (0-255). Change the values 400 and 900 below
  // to match the range your analog input gives:
  int brightness = map(rightSensorValue, 400, 900, 0, 255);
  analogWrite(redLED, brightness);  // set the LED brightness with the result
  Serial.println(rightSensorValue);   // print the sensor value back to the serial monitor
Finish the main loop by doing the same thing with the left sensor and the green LED.
 // now do the same for the other sensor and LED:
  leftSensorValue = analogRead(A1); // read the pot value
  // constrain the sensor value in case the raw values go
  // below 400 or above 900:
  leftSensorValue = constrain(leftSensorValue, 400, 900);
  // map the sensor value to the brightness again. No need to
  // declare the variable again, since you did so above:
  brightness = map(leftSensorValue, 400, 900, 0, 255);
  analogWrite(greenLED, brightness);  // set the LED brightness with the result
  Serial.println(leftSensorValue);   // print the sensor value back to the serial monitor
}
Mapping works for audible tones as well. Human hearing is in a range from 20Hz to 20 kHz, with 100 – 10000 Hz being a reasonable middle ground so if your input is in a range from 0 to 255, you can quickly get audible tones by mapping like so:
int pitch = map(input, 0, 255, 100, 10000);
When you run this, you should see the LEDs changing in brightness, or hear the speaker changing in pitch, as you press the sensors. This is the central function of analog sensors on a microcontroller: to allow for a variable range of input to control a variable range out output. Whether your sensor is read through an analog sensor like this, or through synchronous serial interfaces as you’ll see in the SPI and I2C labs, you always need to find out how the range of action from the user relates to the range of values that the sensor produces. Once you’re comfortable with this concept, get to know how to read the change in a sensor’s readings as well.