This lab uses a p5.js library called p5.WebSerial to make it easy in p5.js. In this lab, you’ll generate an analog output value from a potentiometer, then send that value via asynchronous serial communication to P5.js. You’ll use that value in P5.js to draw a graph.
Web browsers have traditionally been designed to be separate from the rest of a computer’s operating system, not able to connect to the computer’s hardware ports for security reasons. Recently, however, the W3C developed the WebSerial API in JavaScript, which allows browsers to communicate with a computer’s serial ports. WebSerial is currently only available in the Chrome and Chromium browsers and the Microsoft Edge browser, so make sure you’re using one of those to do this lab.
To get the most out of this tutorial, you should know what a microcontroller is and how to program them. You should also understand asynchronous serial communication between microcontrollers and personal computers. You should also understand the basics of P5.js.
Once you gain an understanding of serial communication, you can use any program that can connect with your computer’s serial ports to communicate with a microcontroller. In addition to the WebSerial API you’ll see here, you can use other programming environments to communicate serially. Processing, Max/MSP, and OpenFrameworks are three other popular multimedia programming environments that can communicate via the serial ports. You can also do this with Unity, Unreal, or any other programming environment that can access the serial ports.
Things You’ll Need
For this lab, you’ll need the hardware below, and you’ll need to create a p5.js sketch. You’ll also use the p5.WebSerial library. You can use the p5.js web editor or your favorite text editor for this (the Visual Studio Code editor works well).
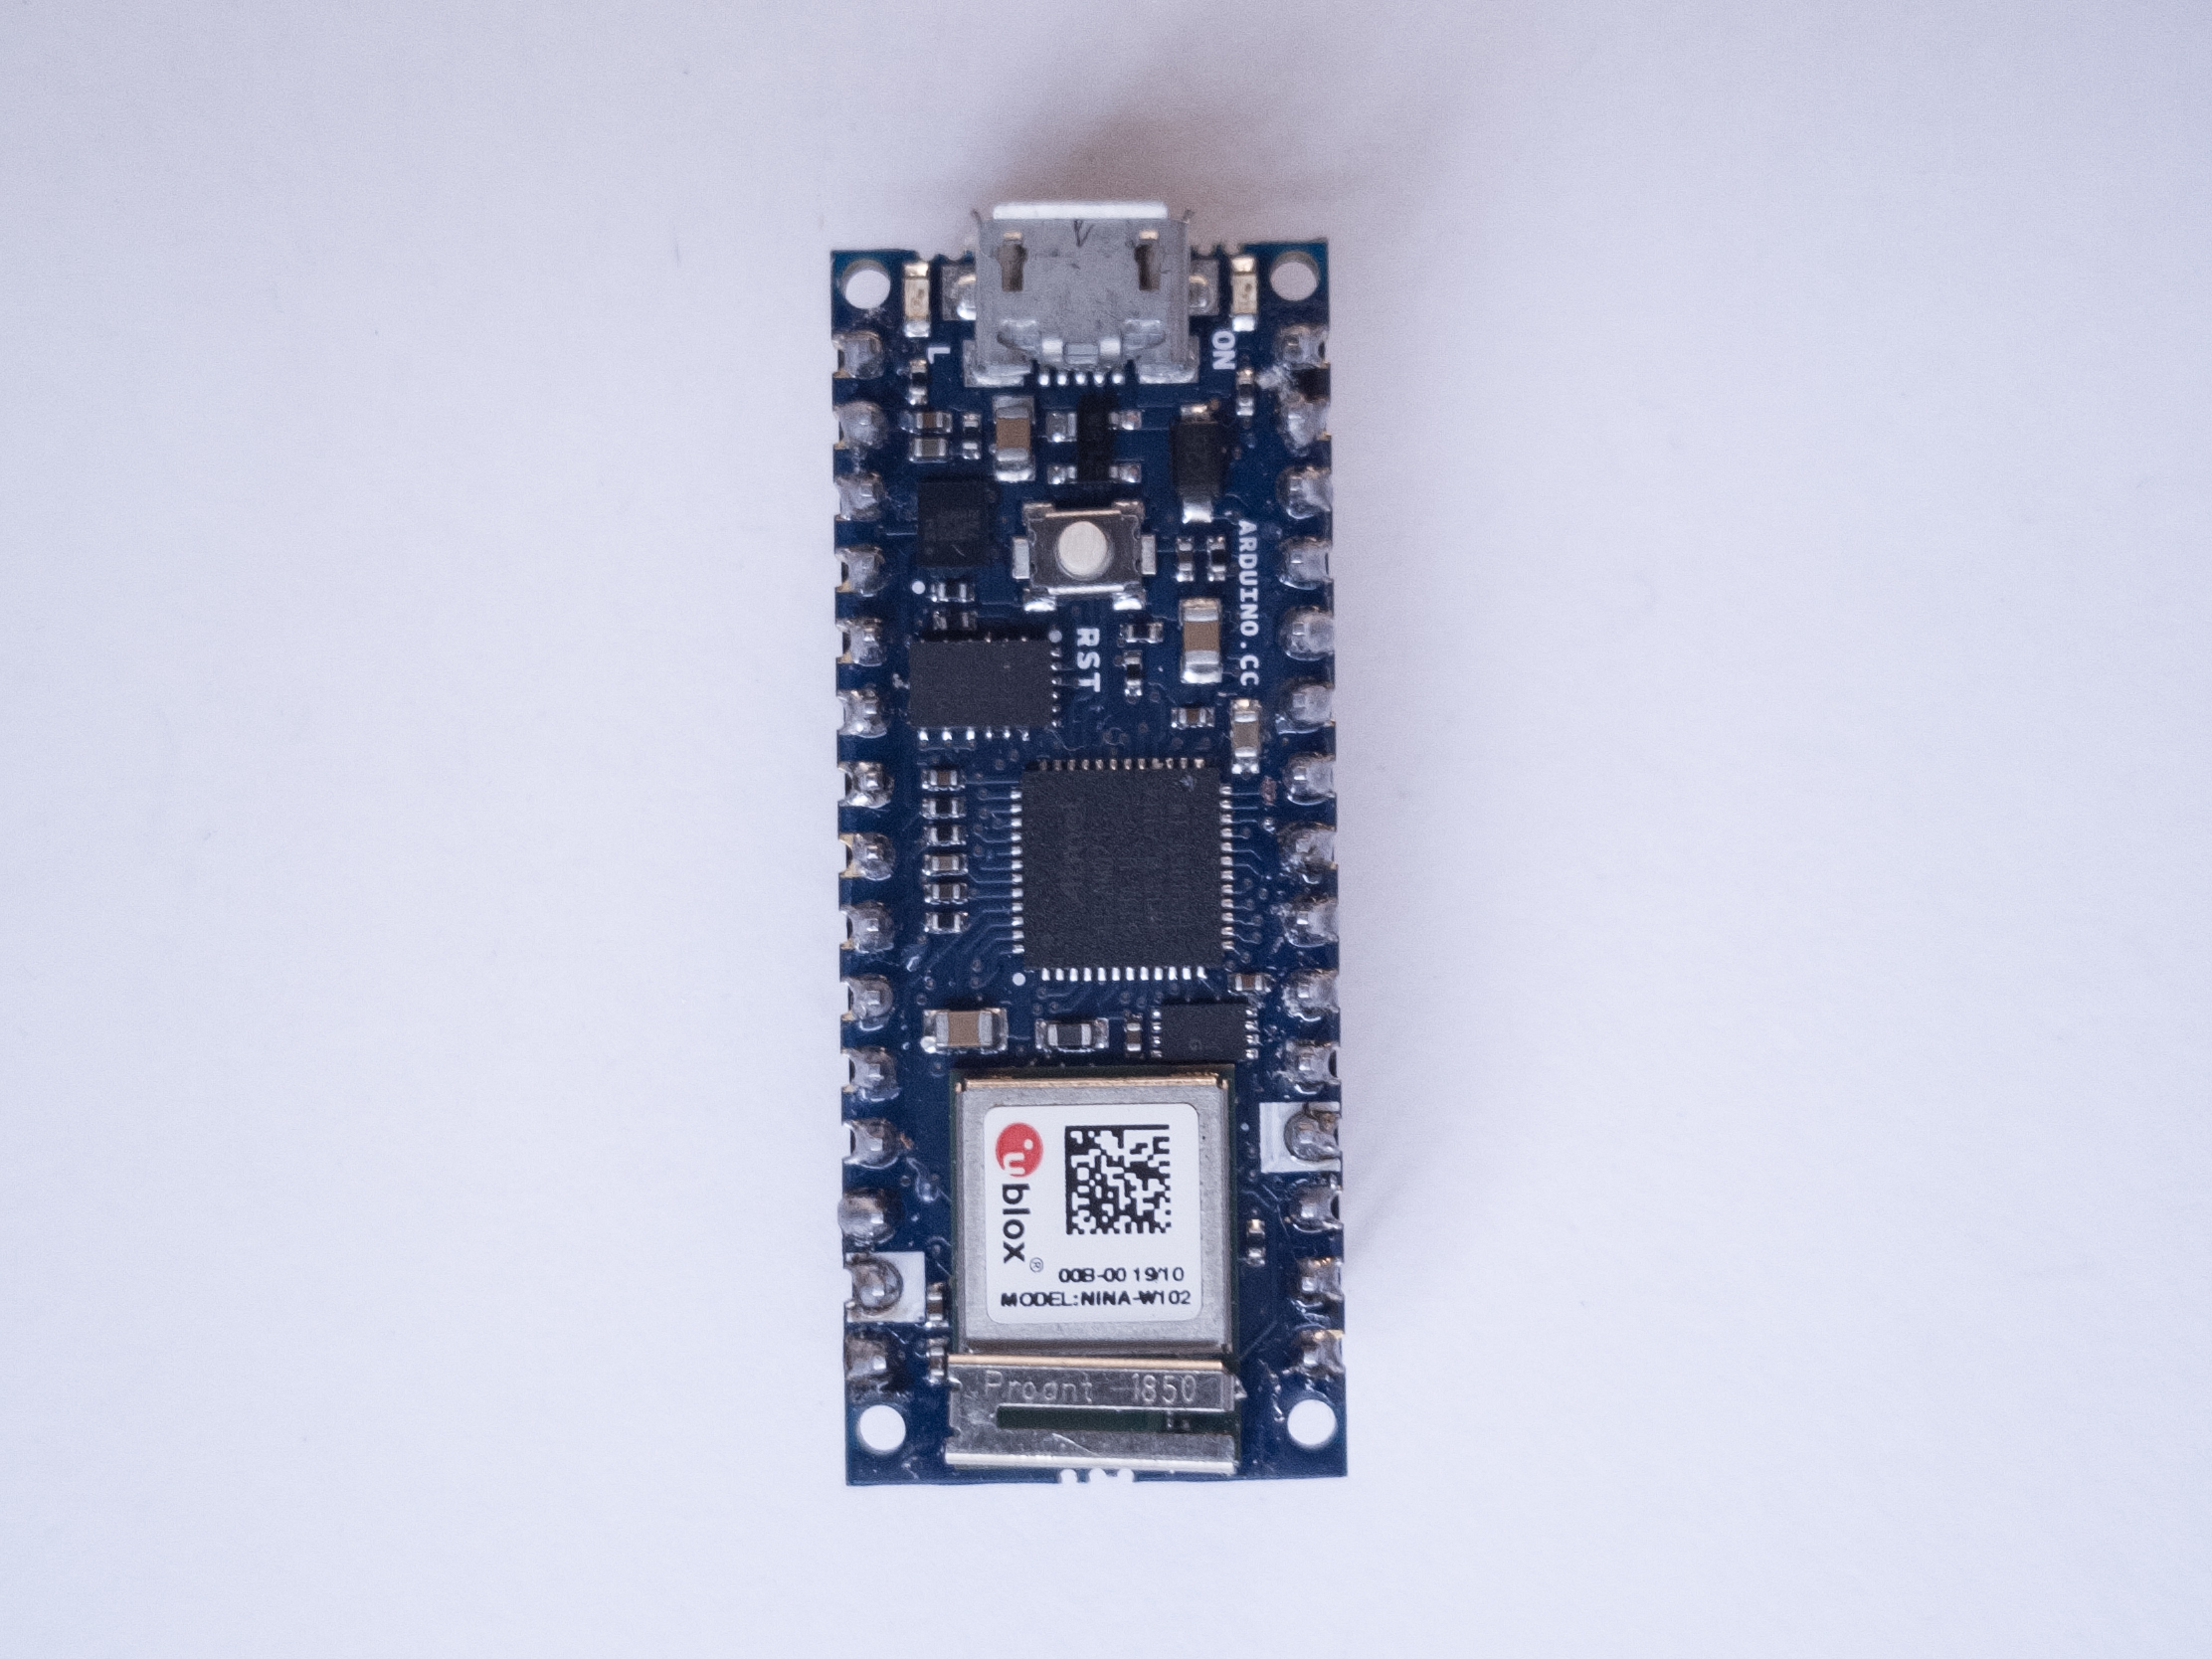
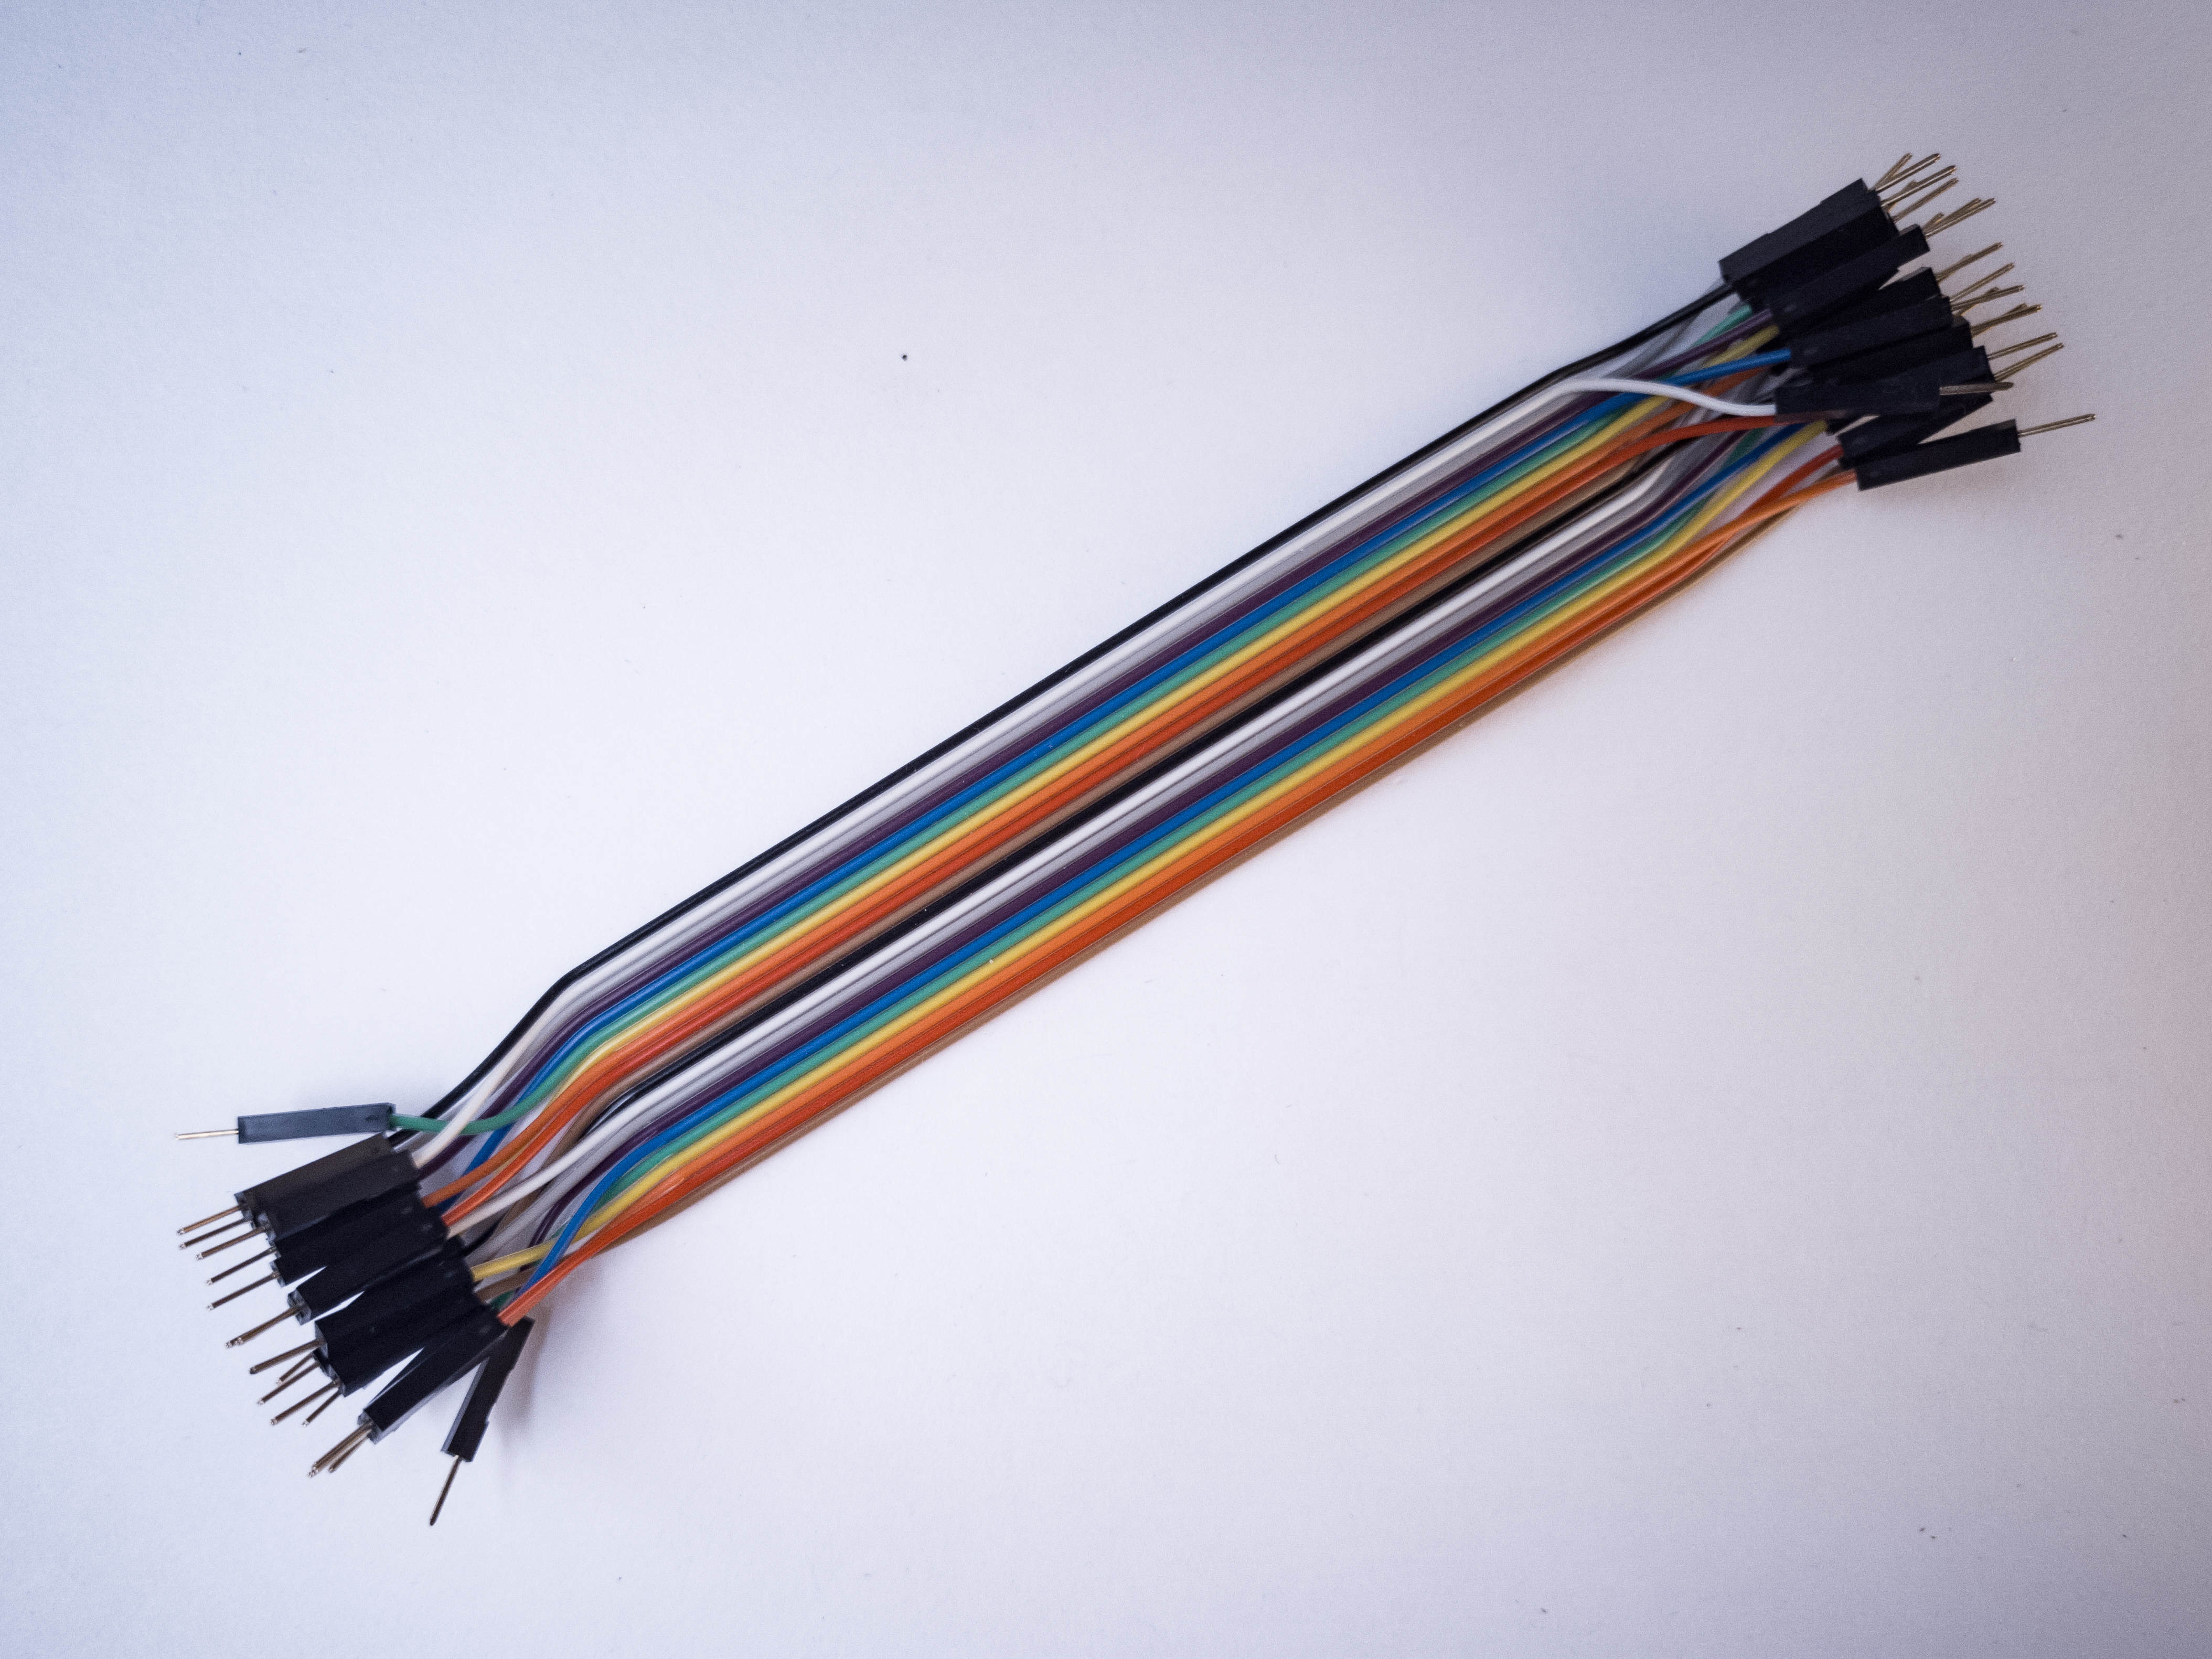
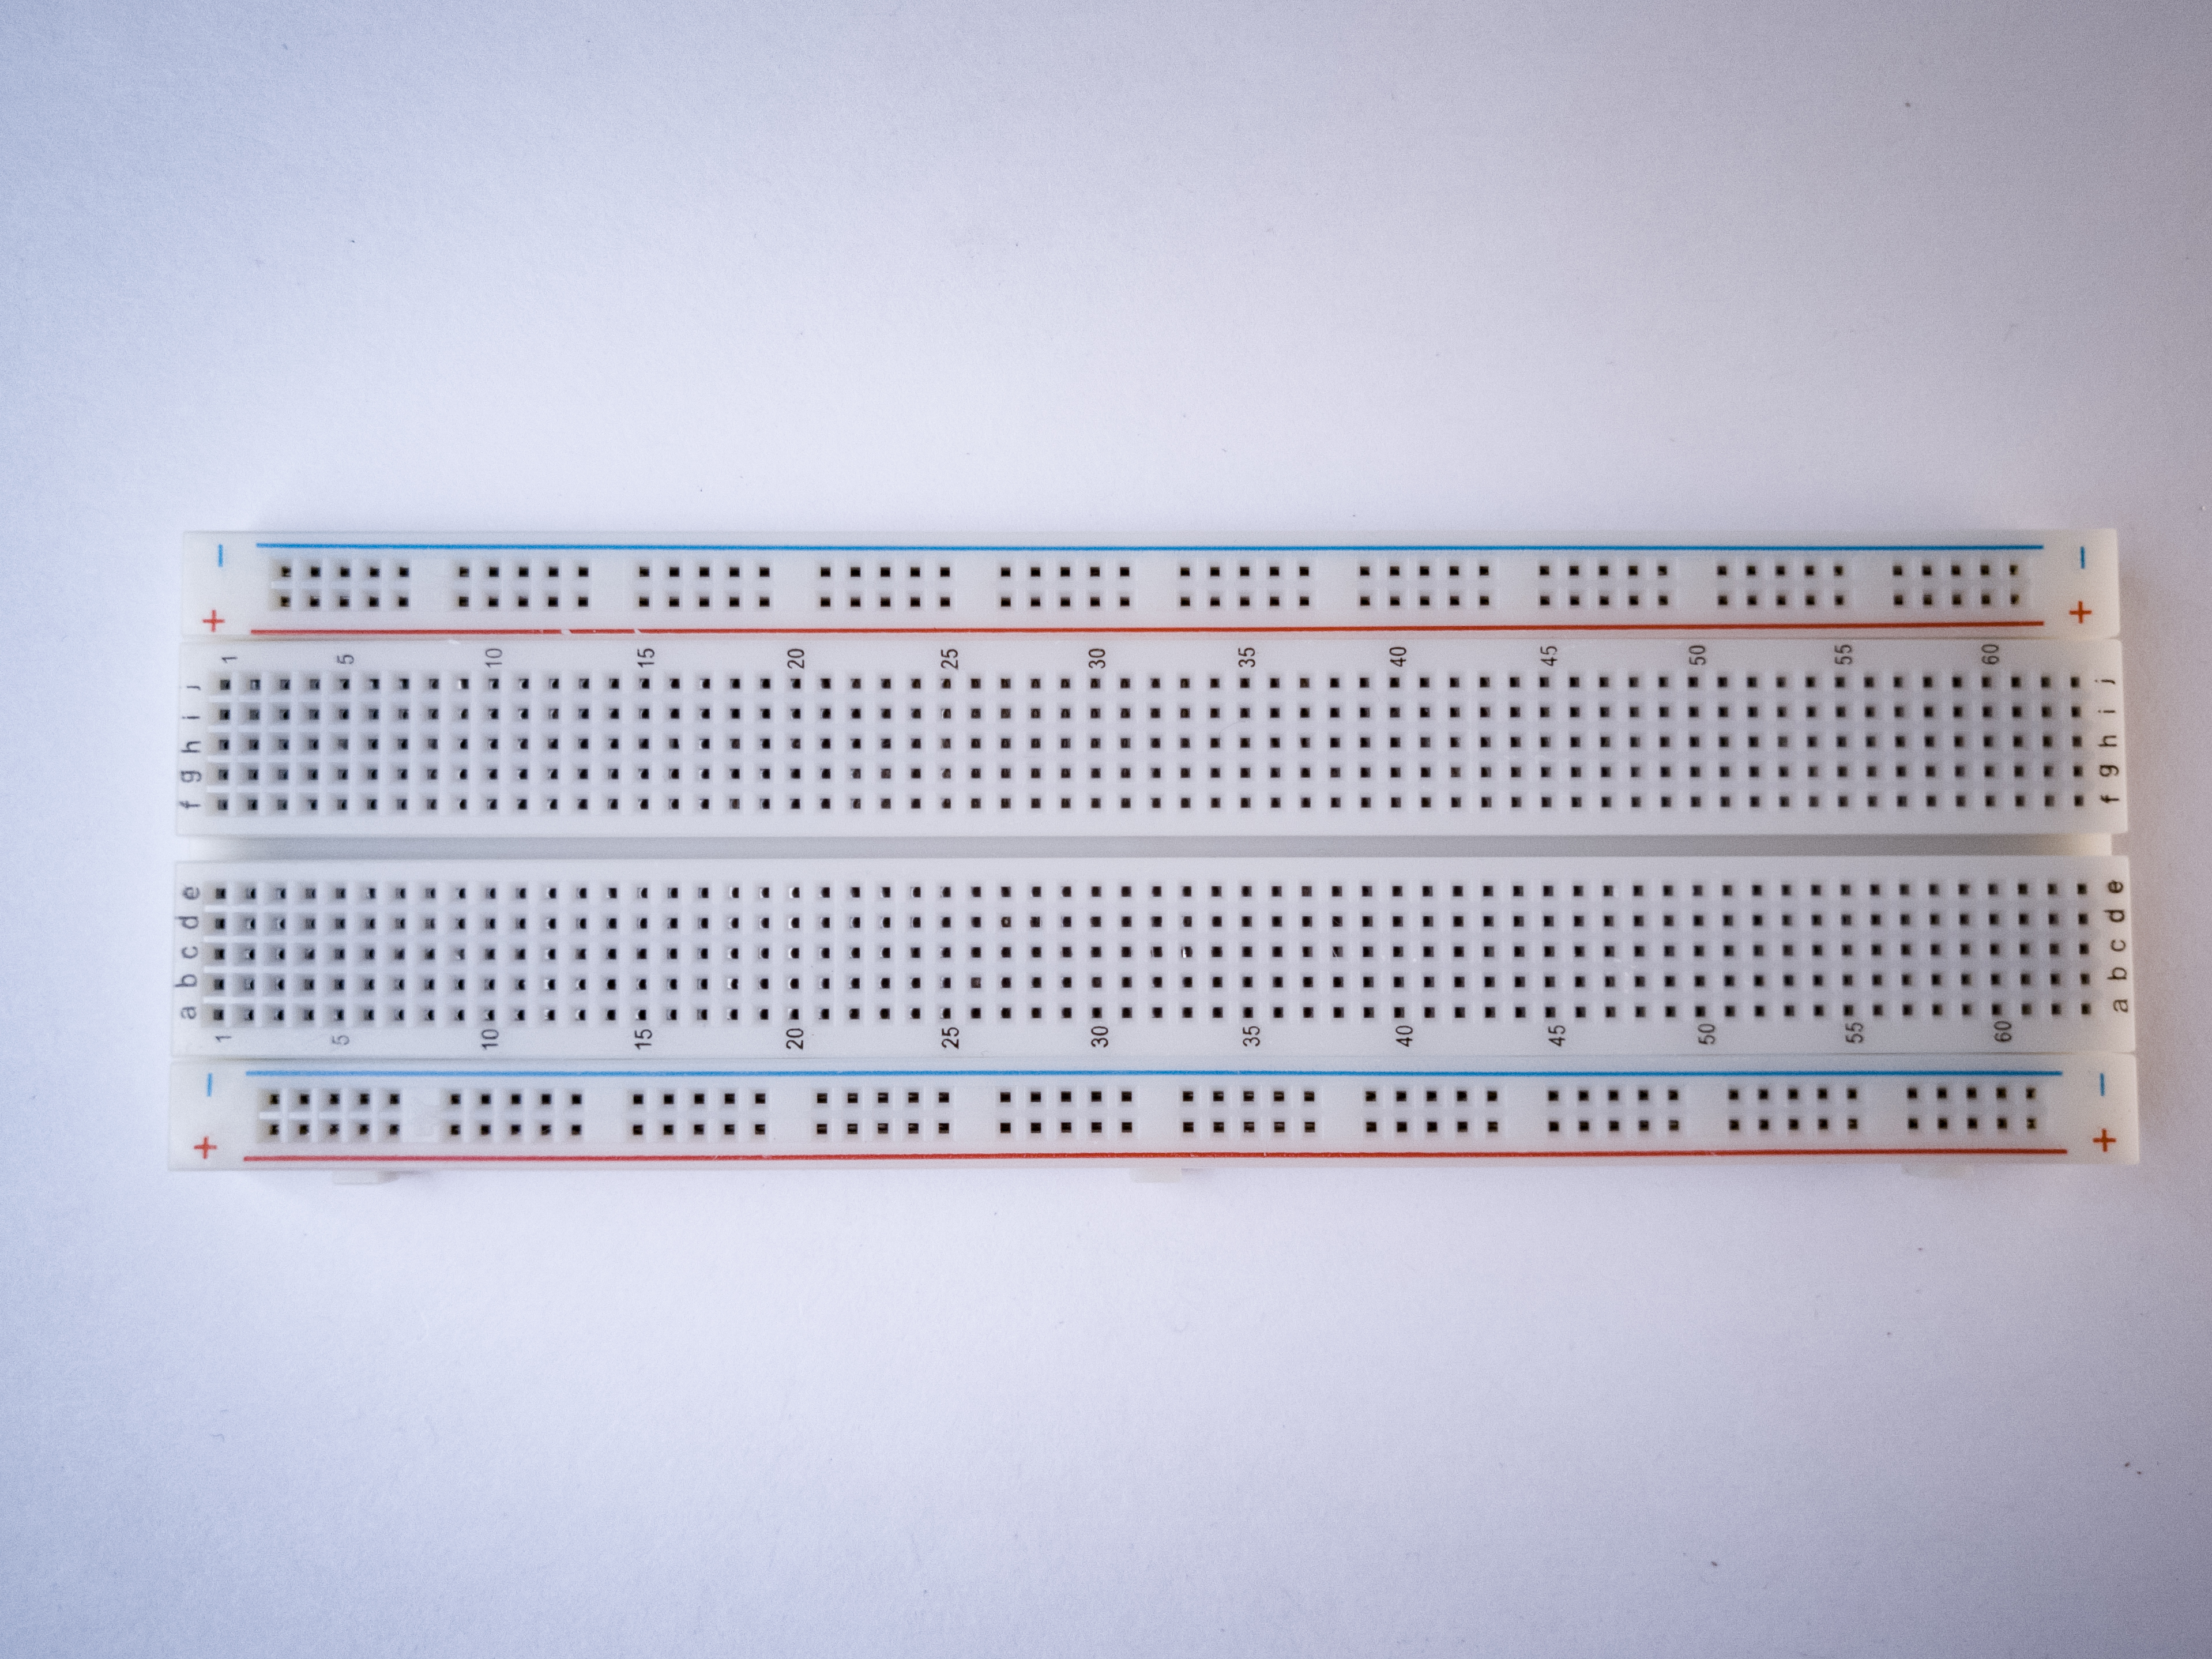
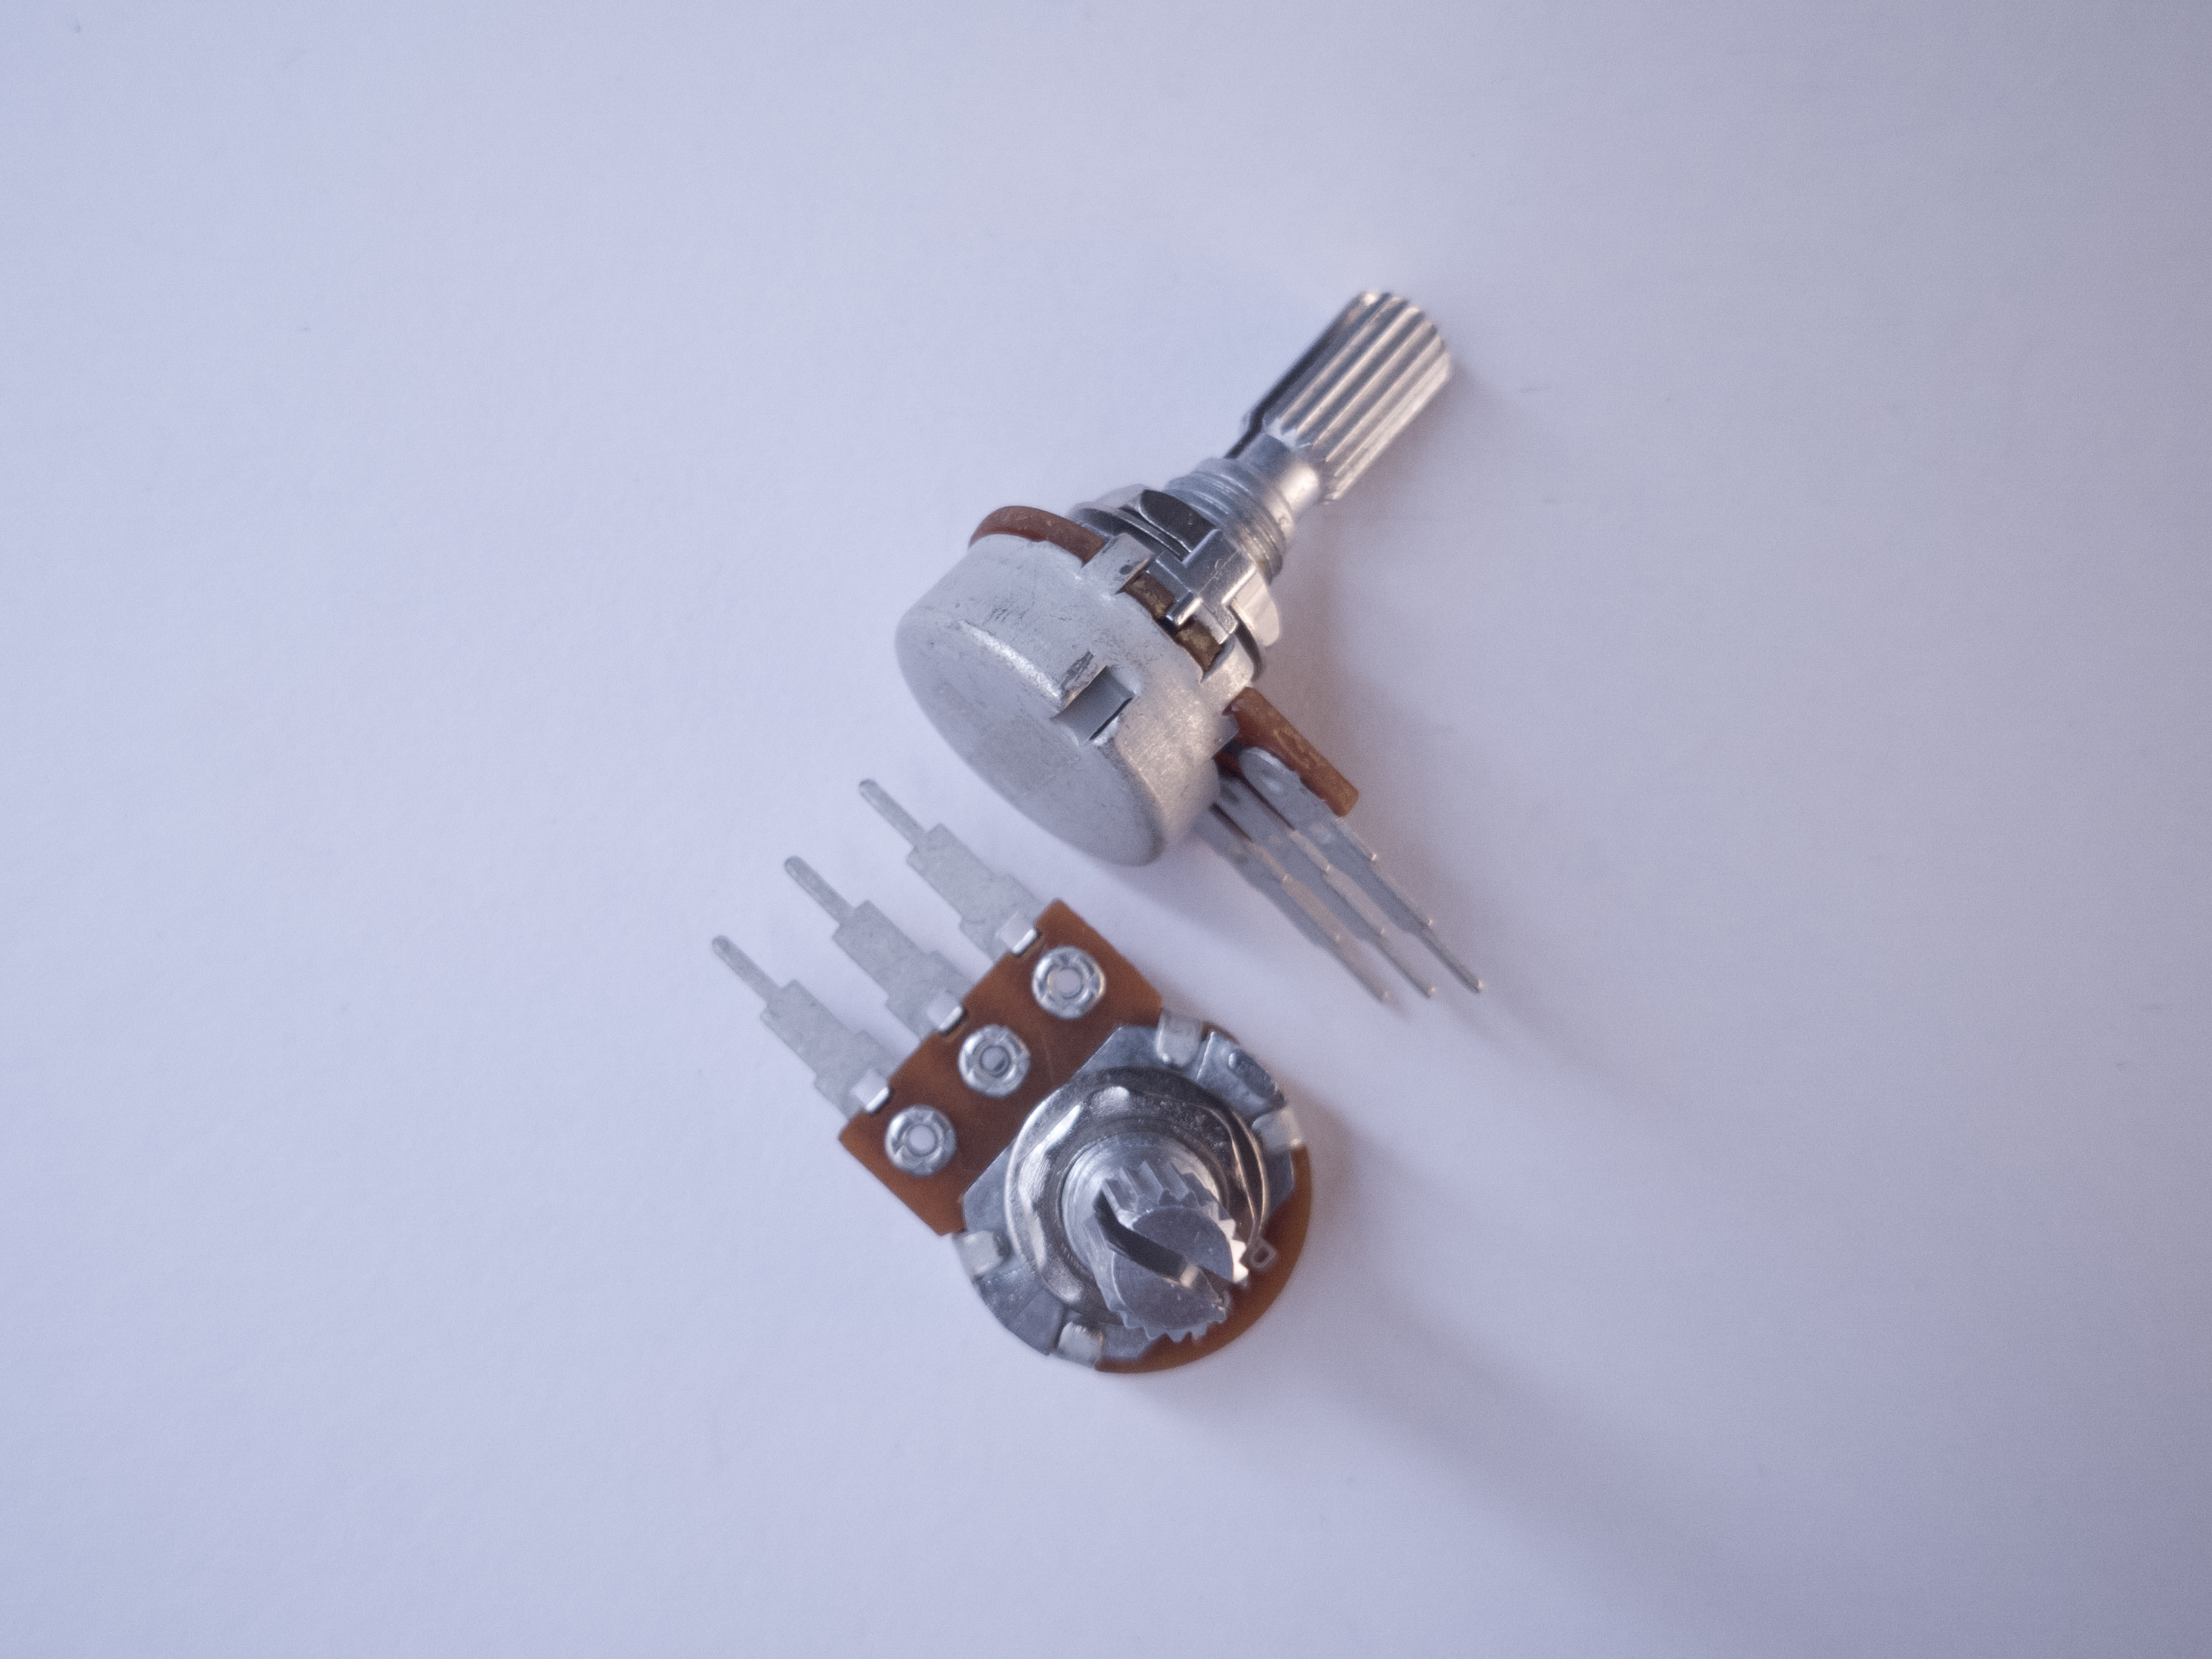
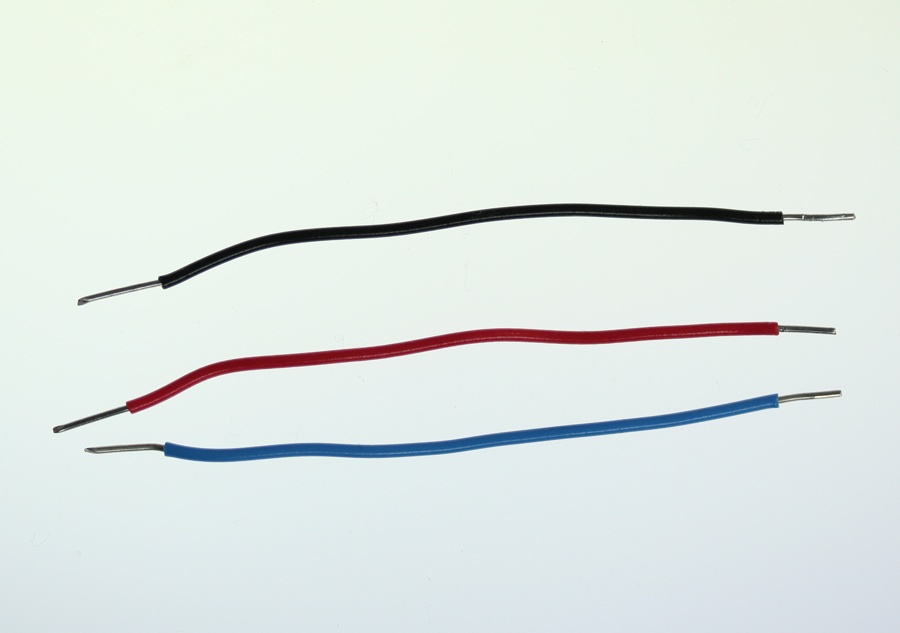
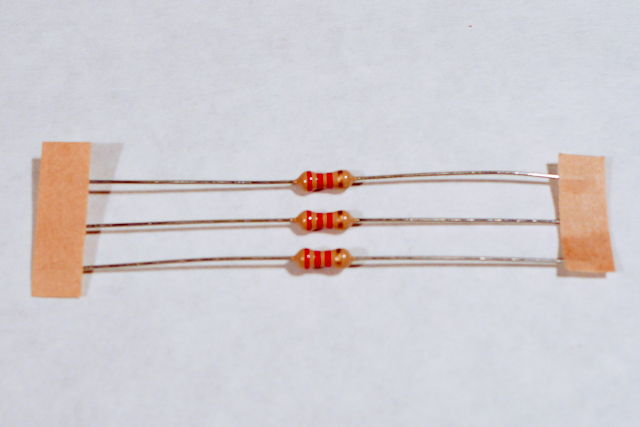
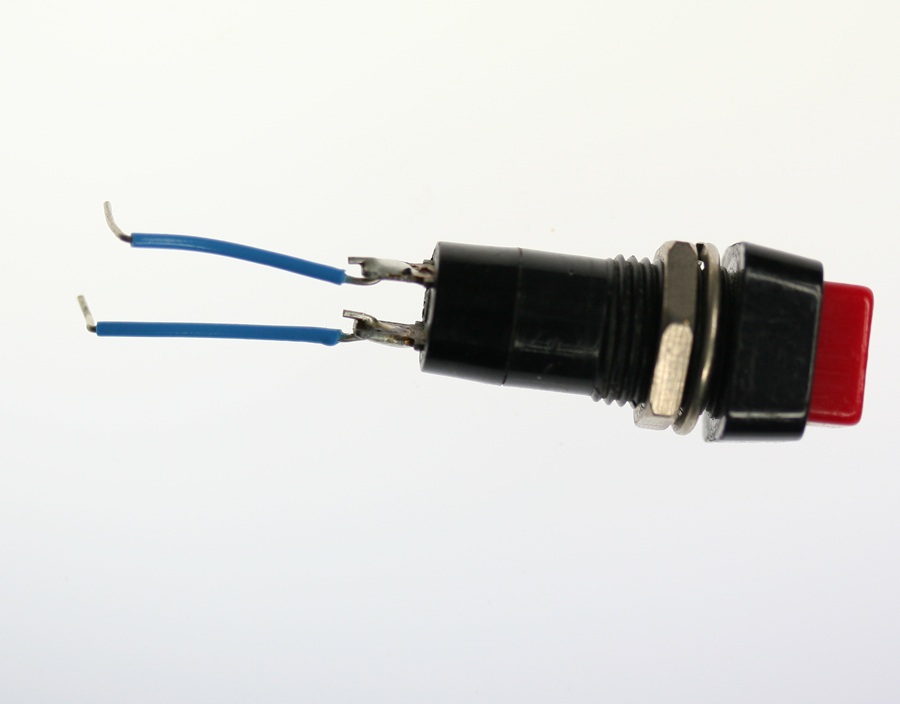
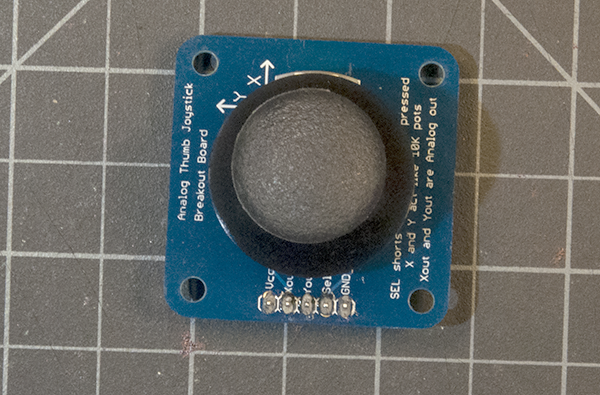
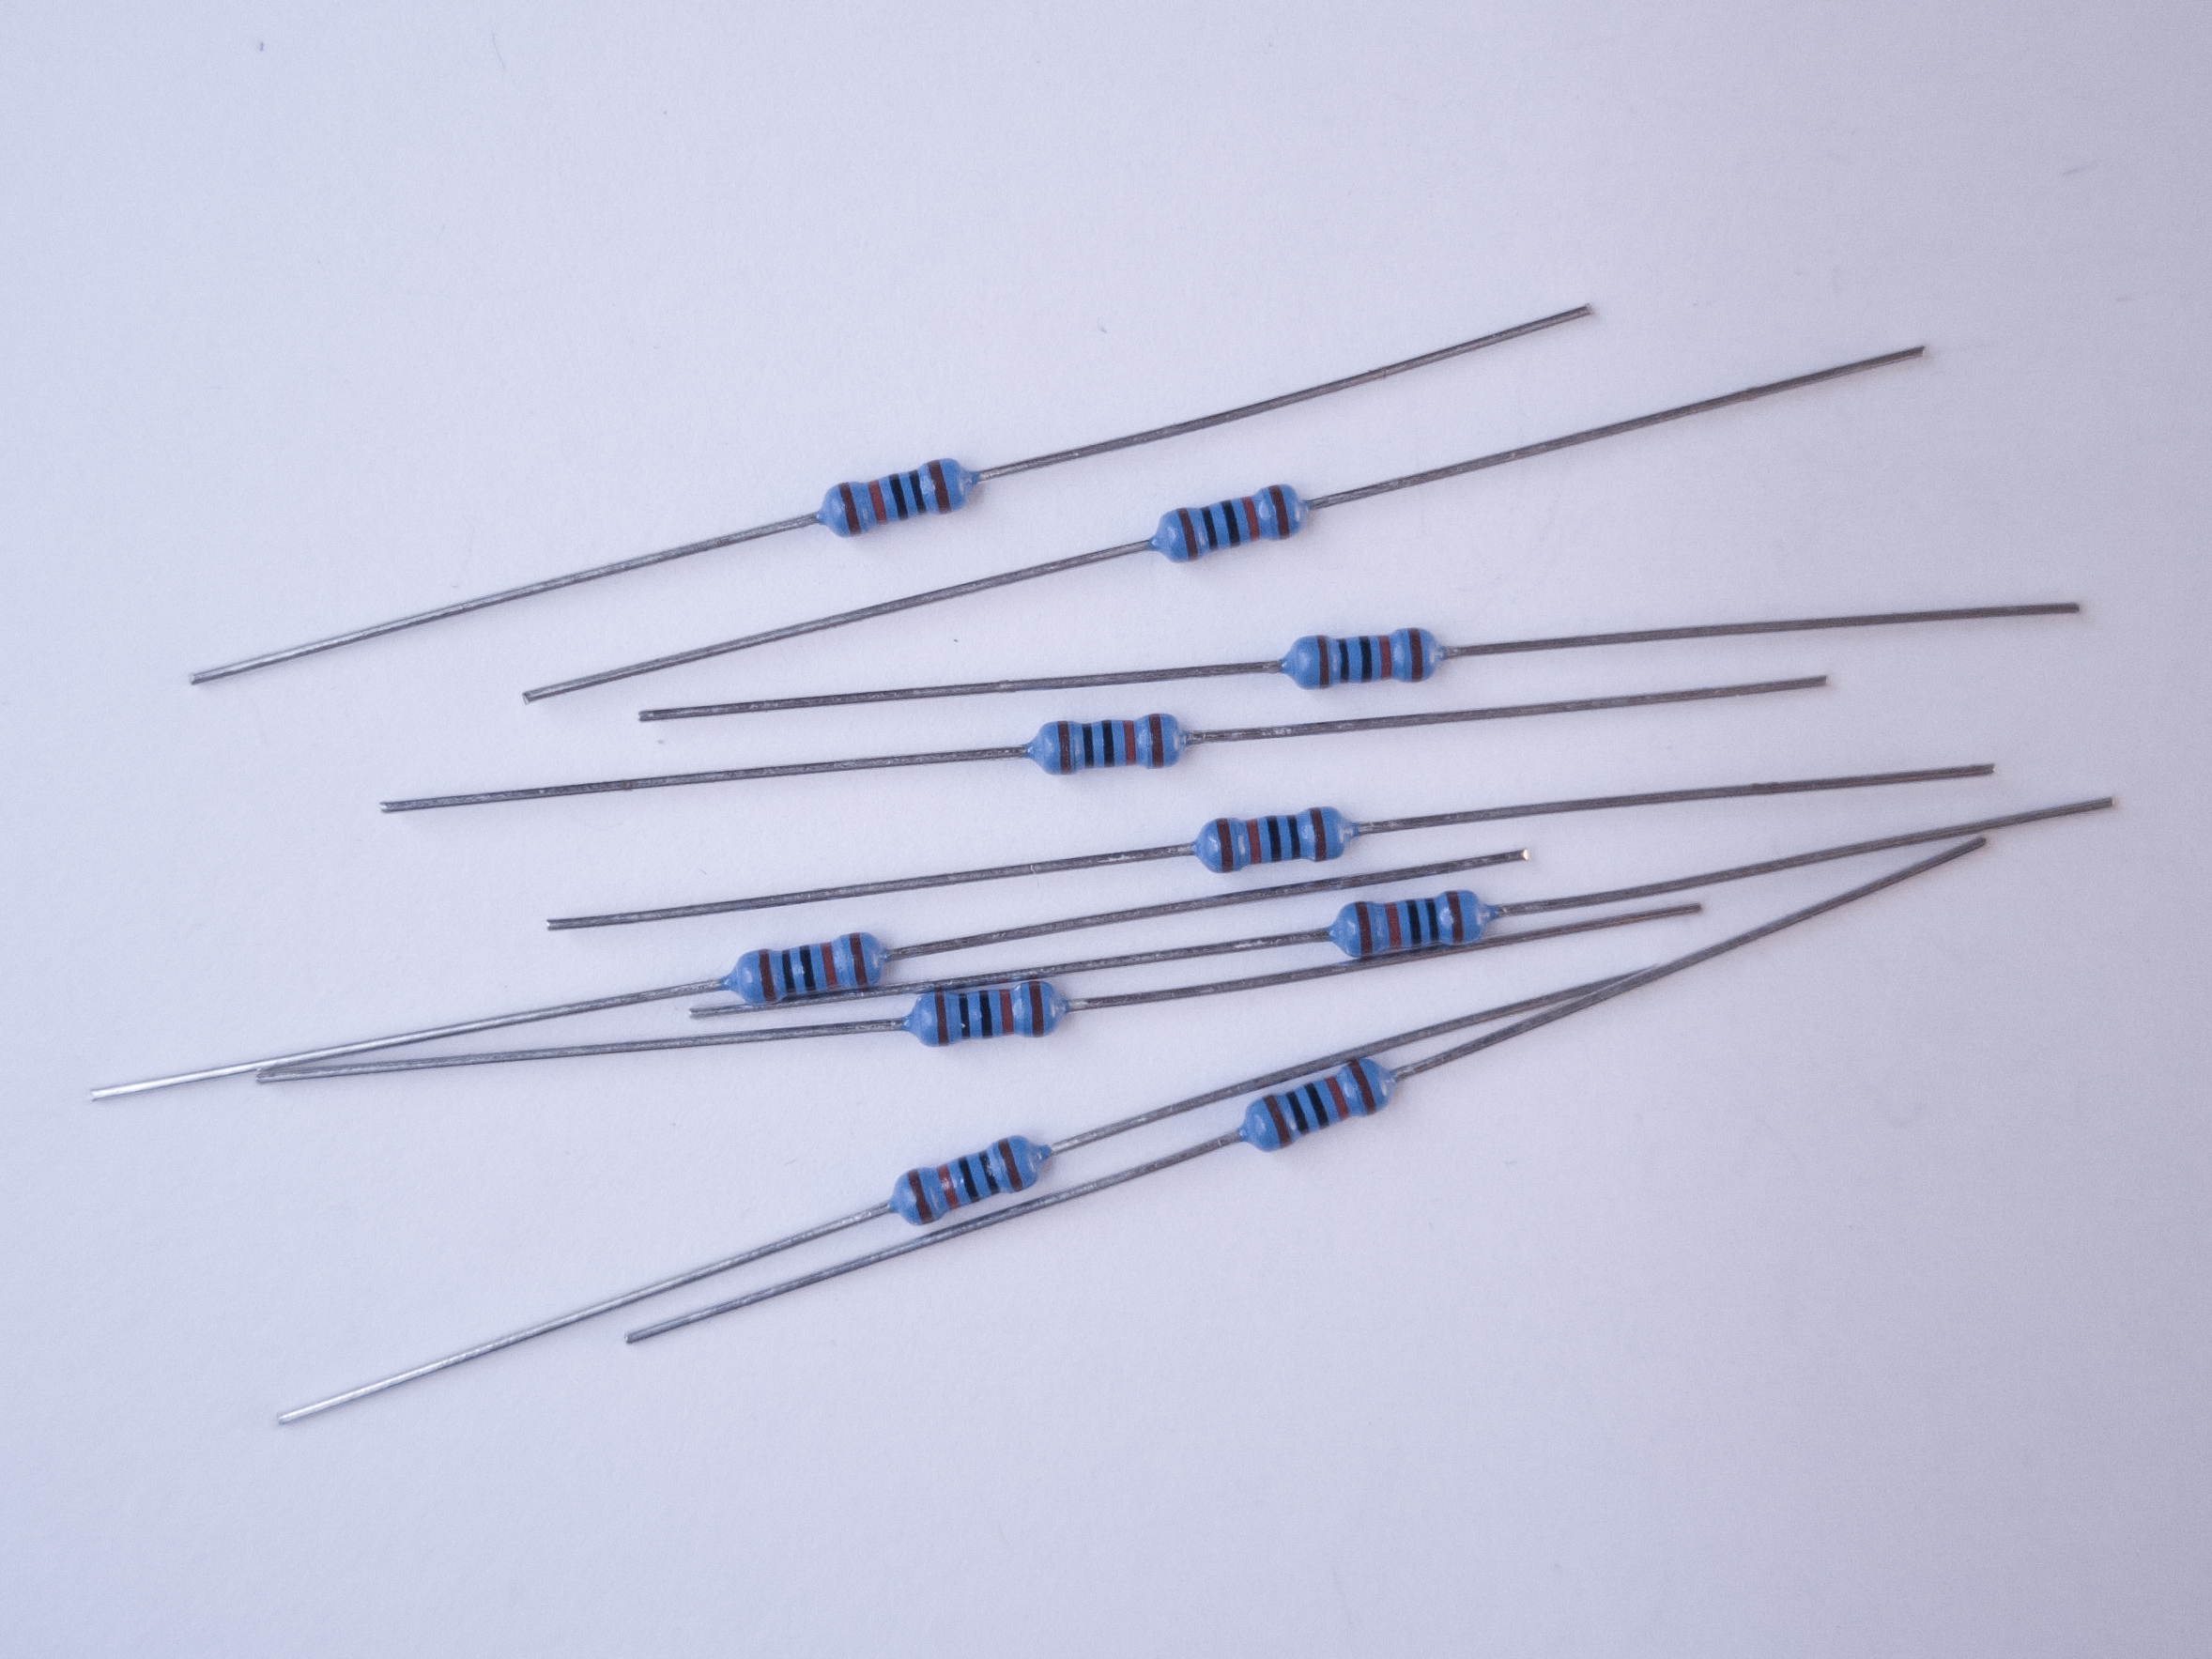
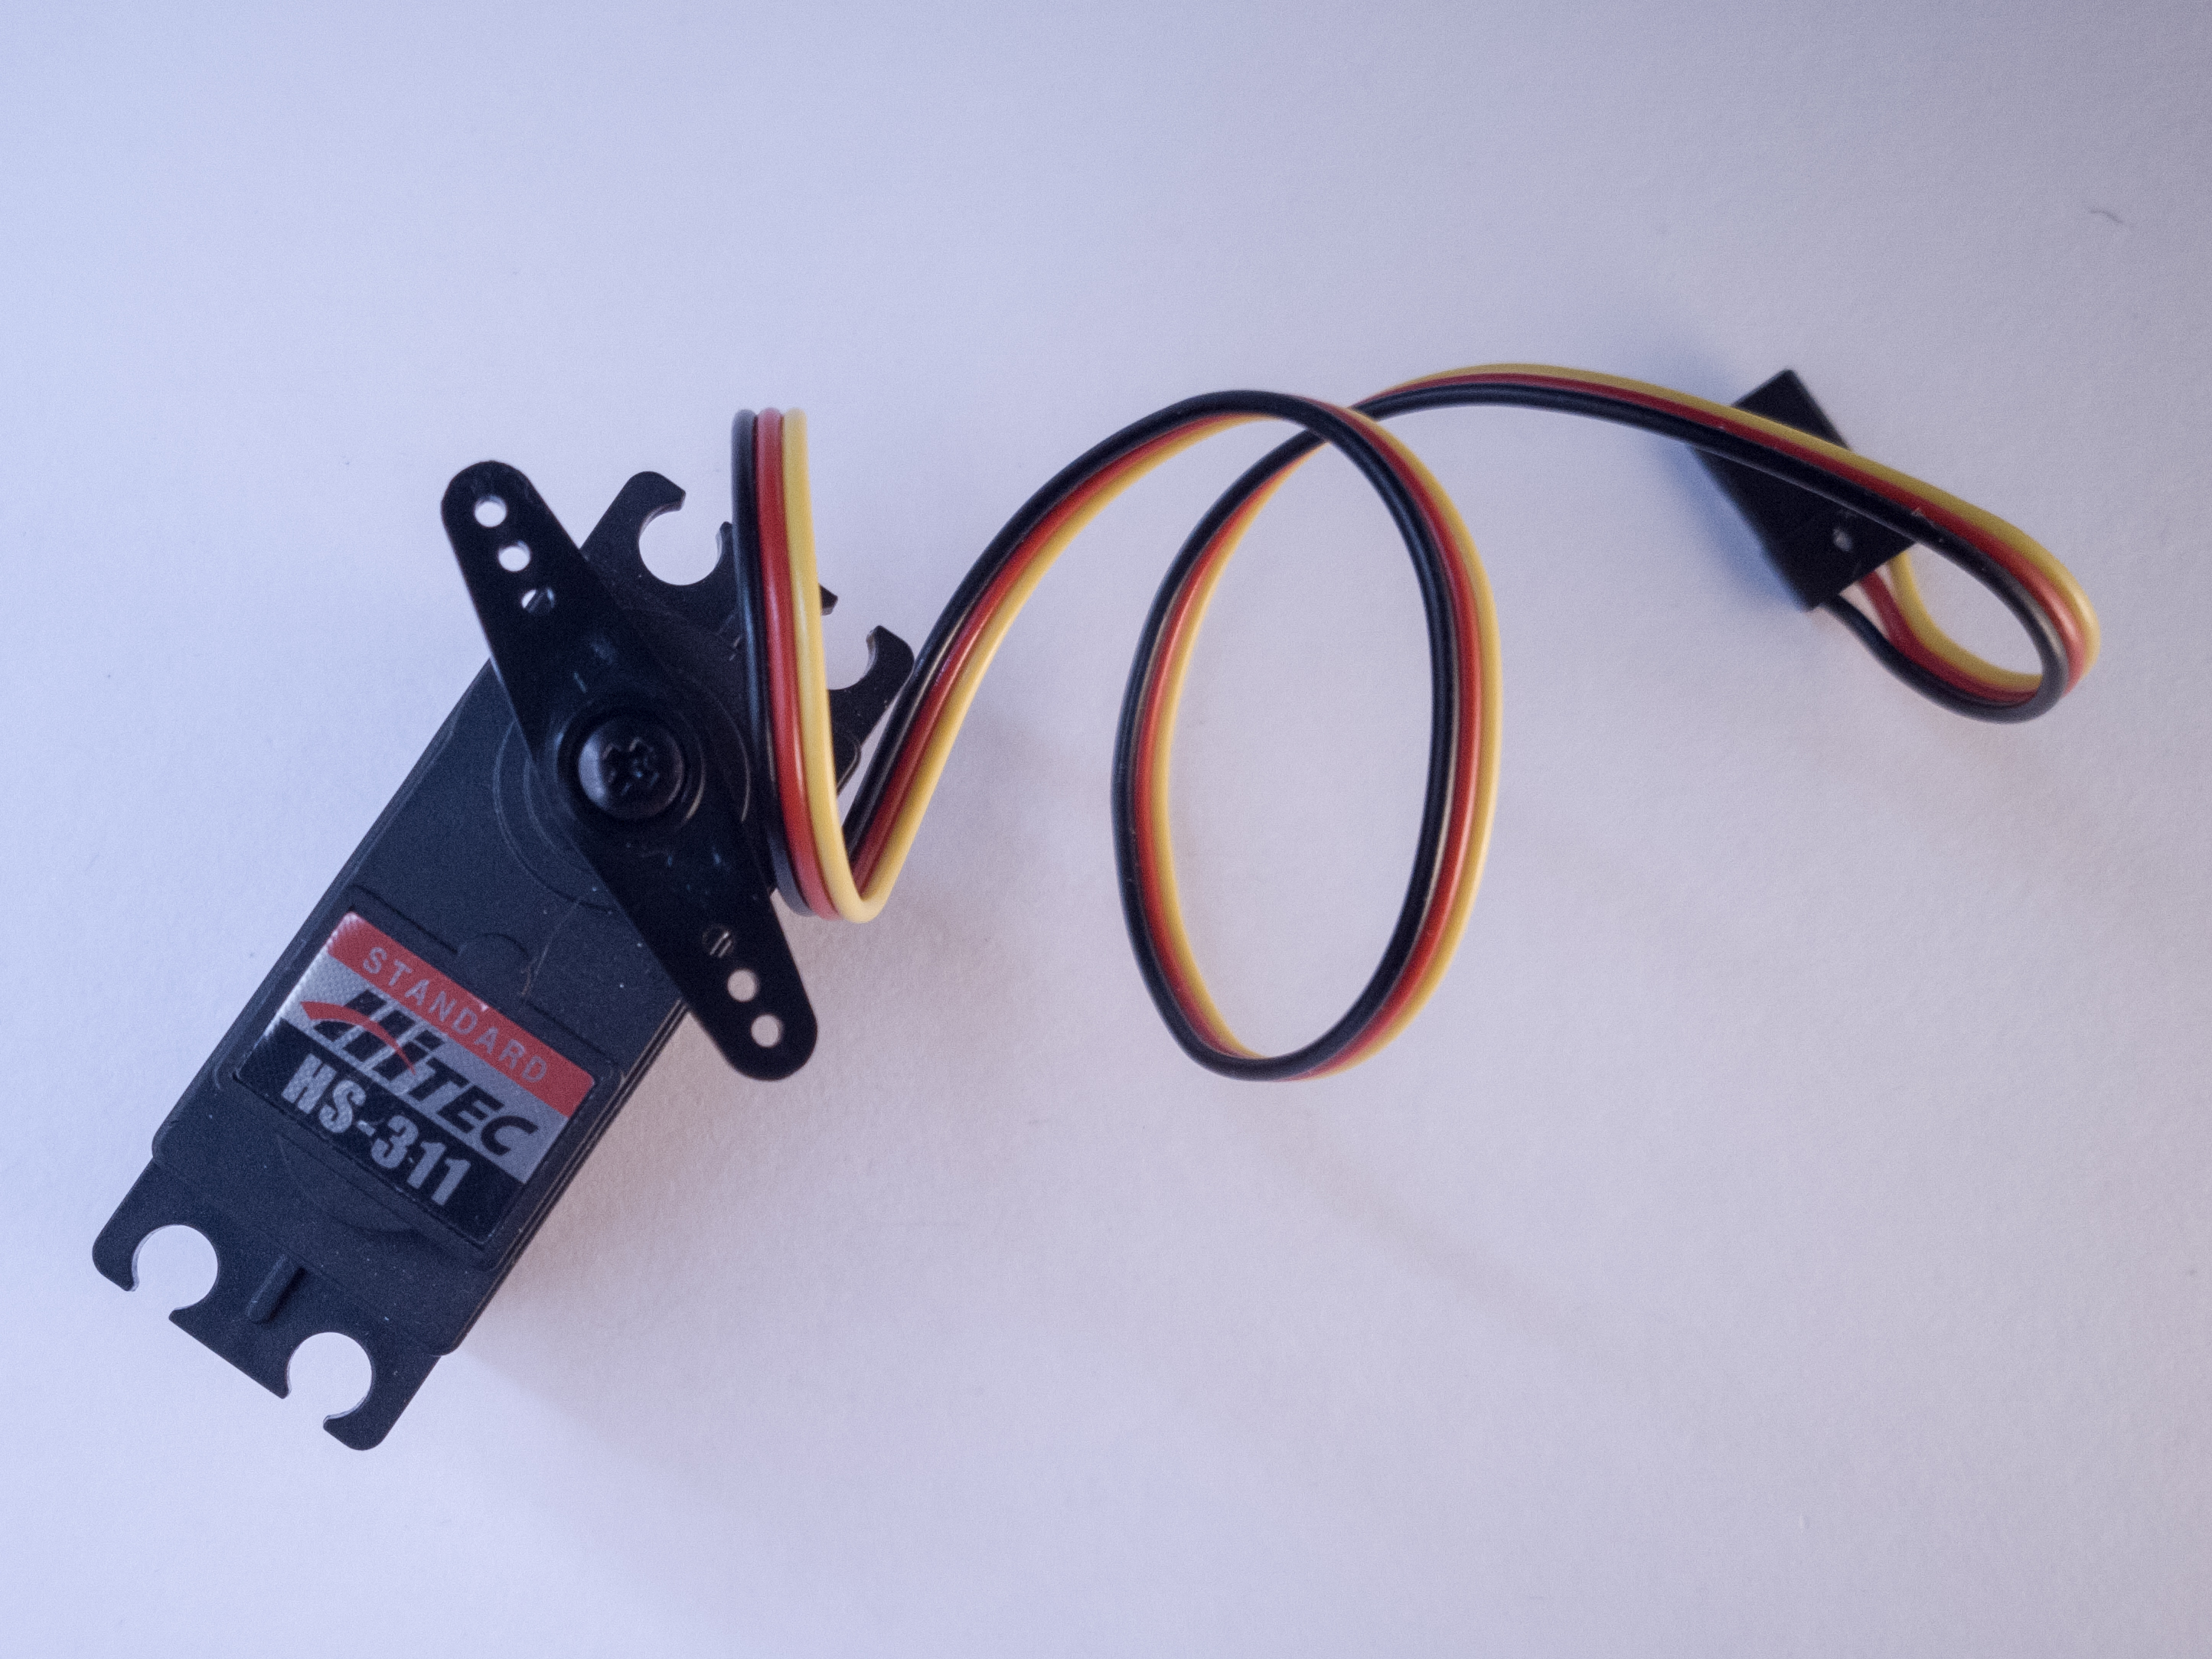
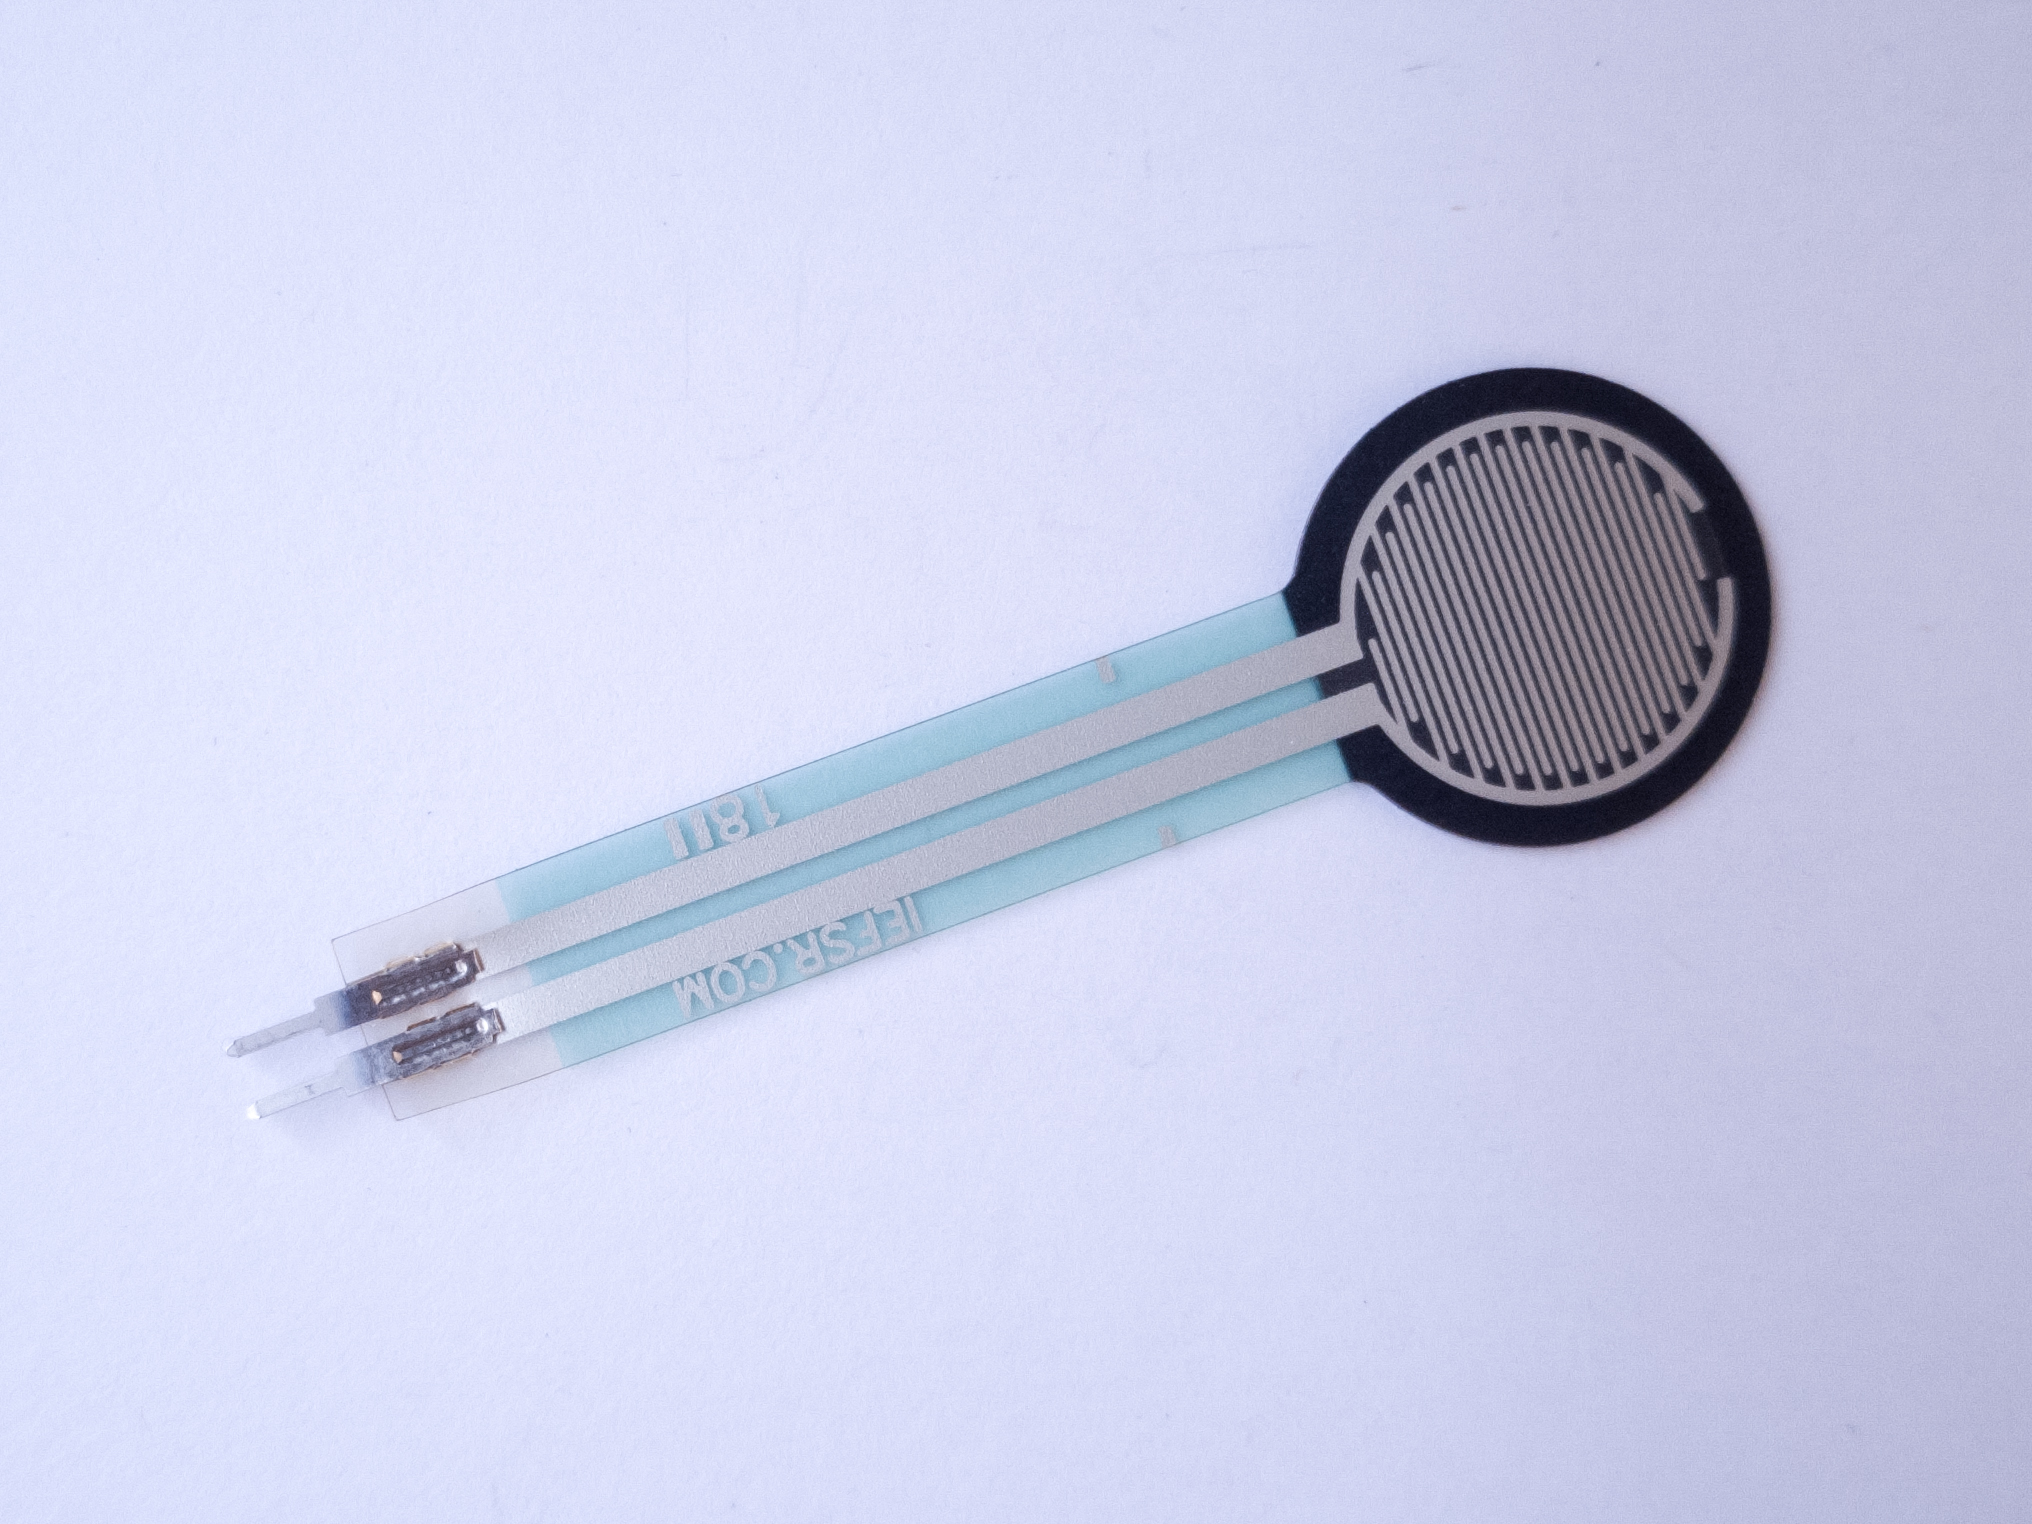
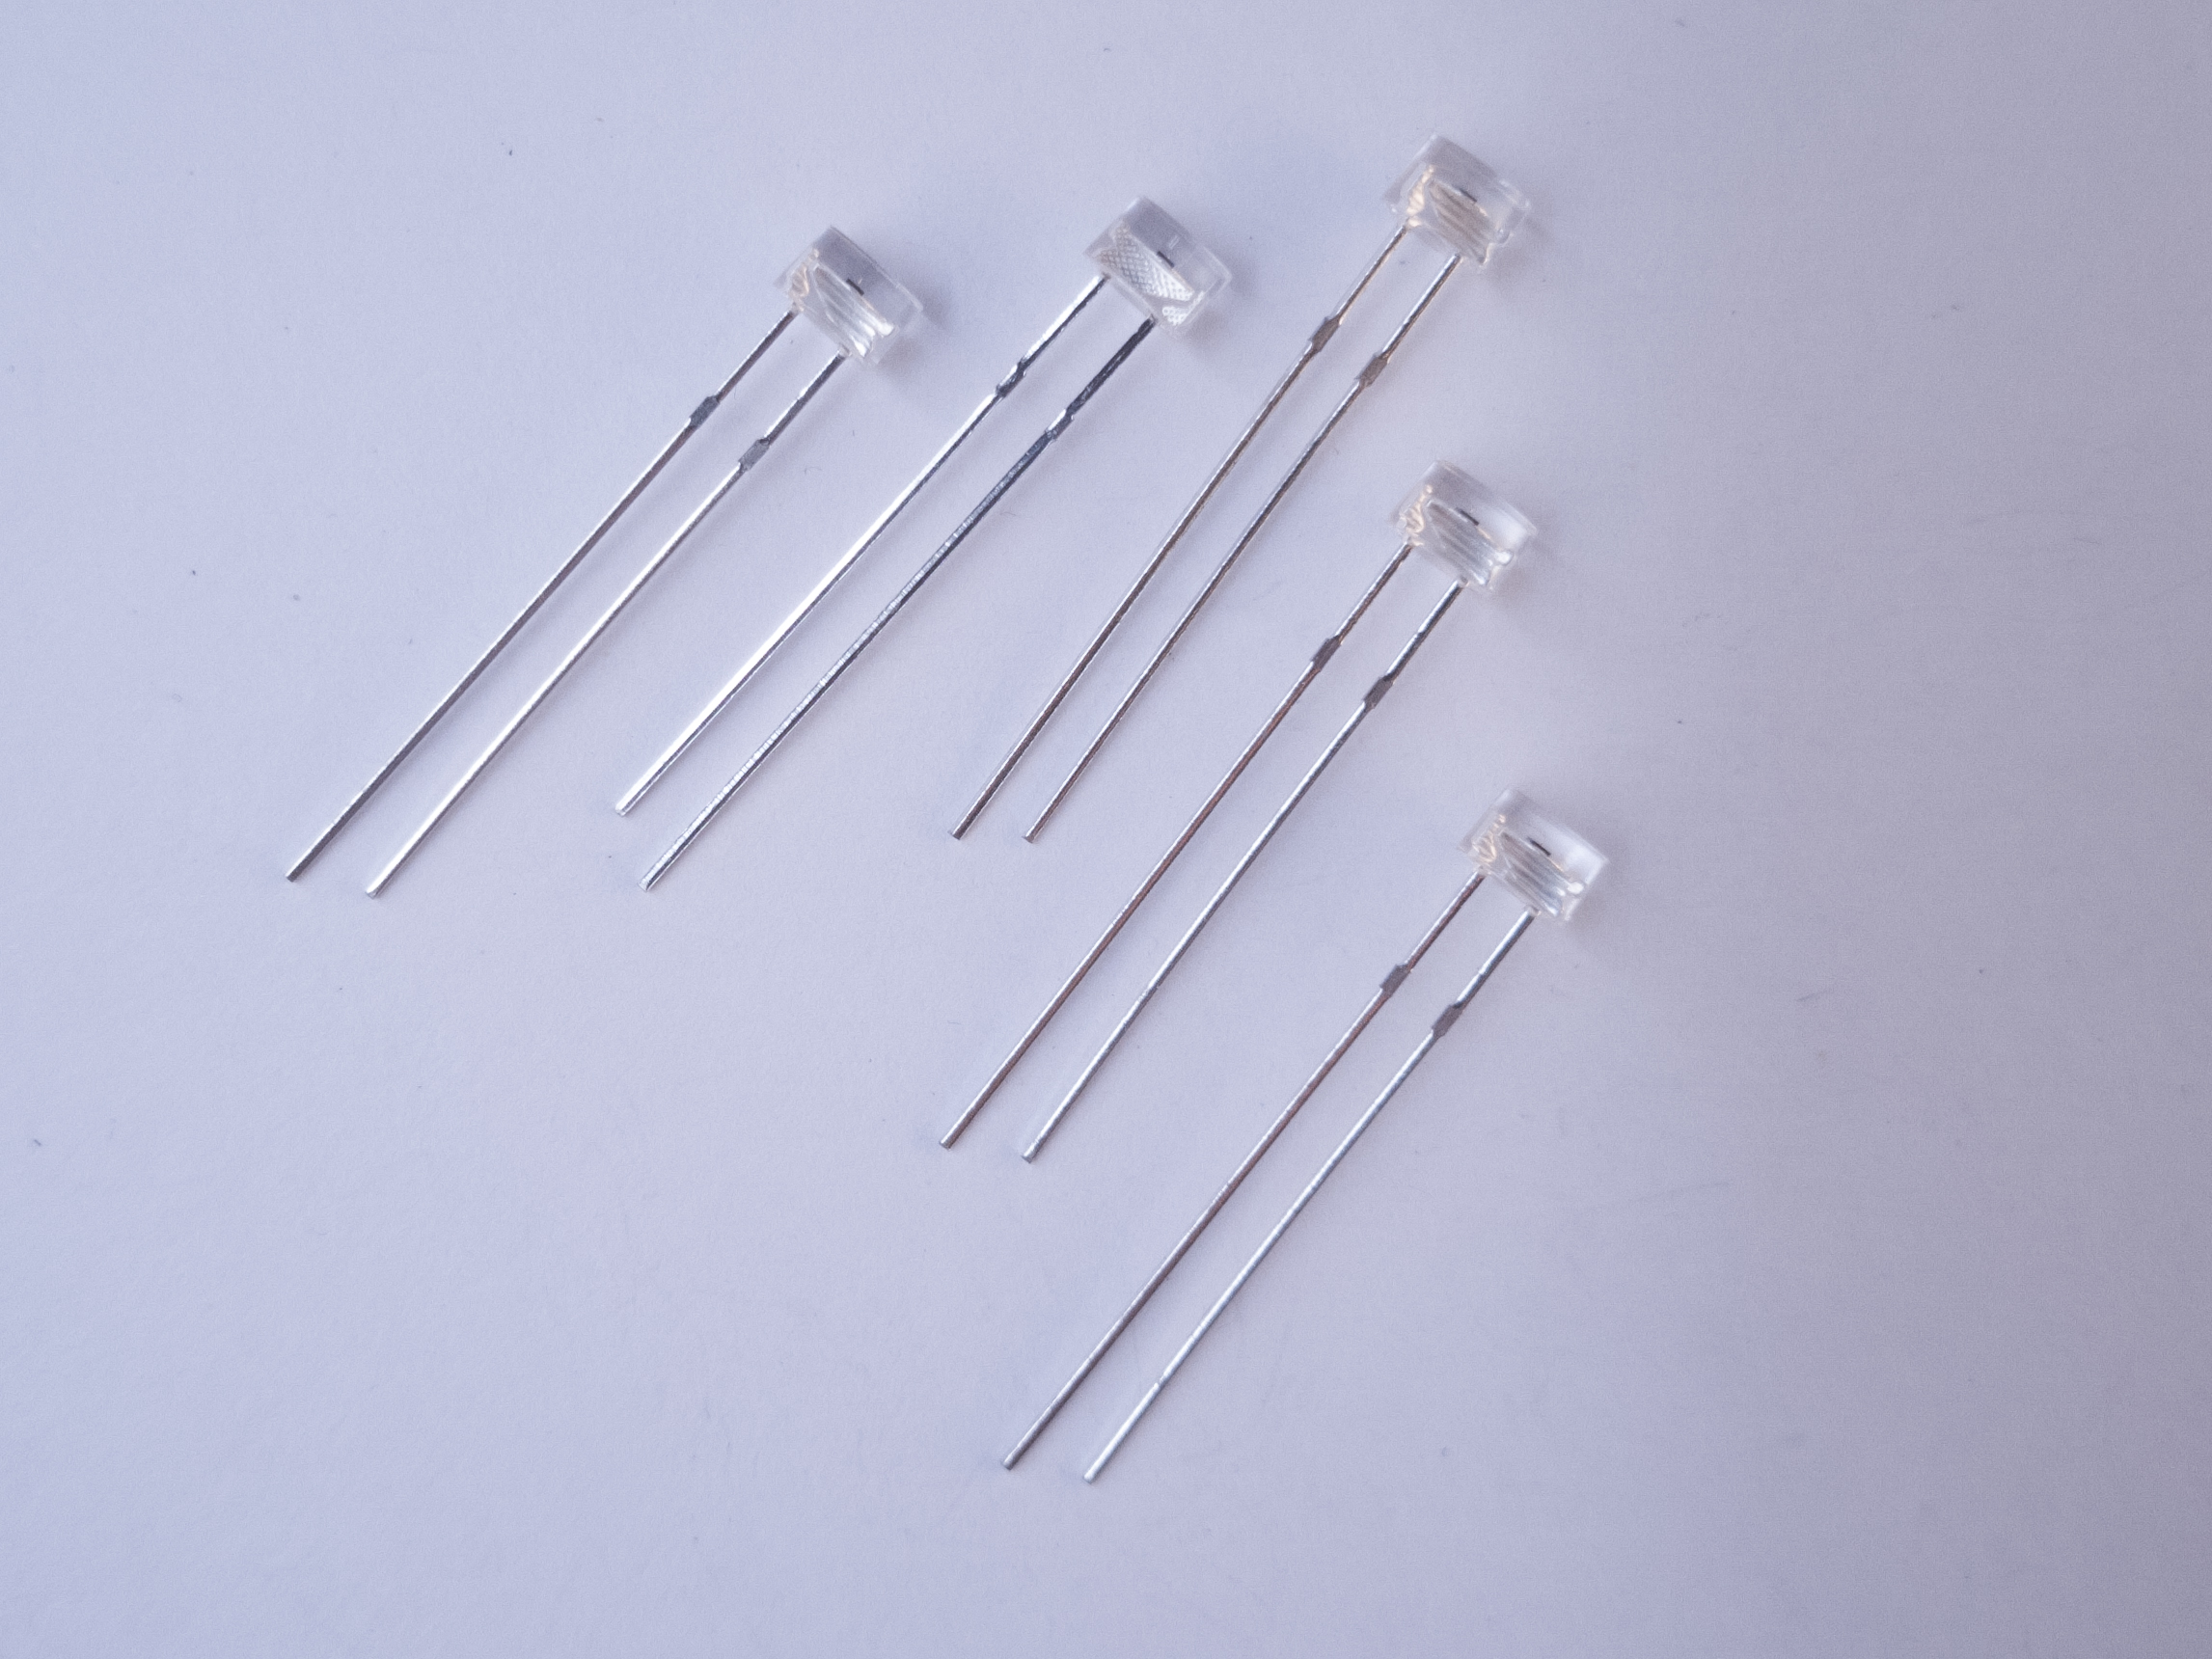
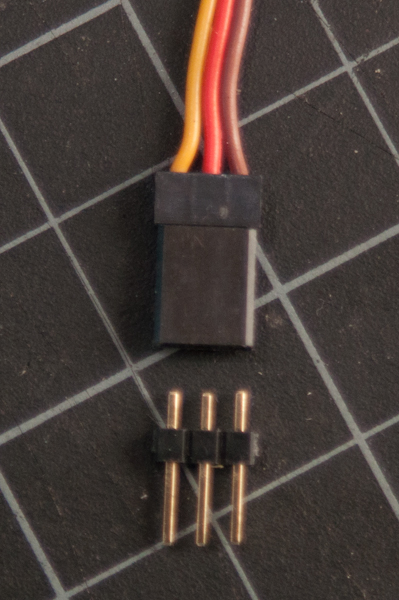
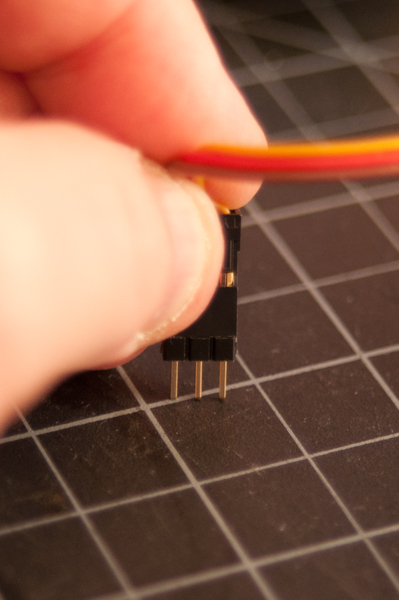
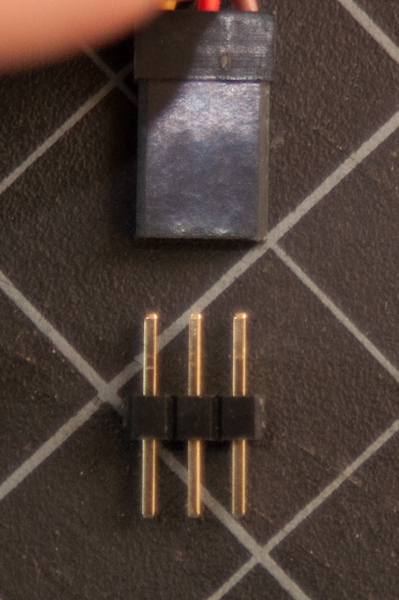
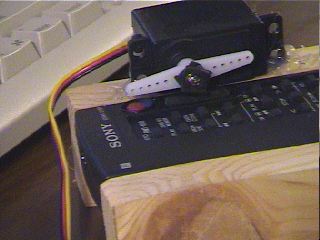
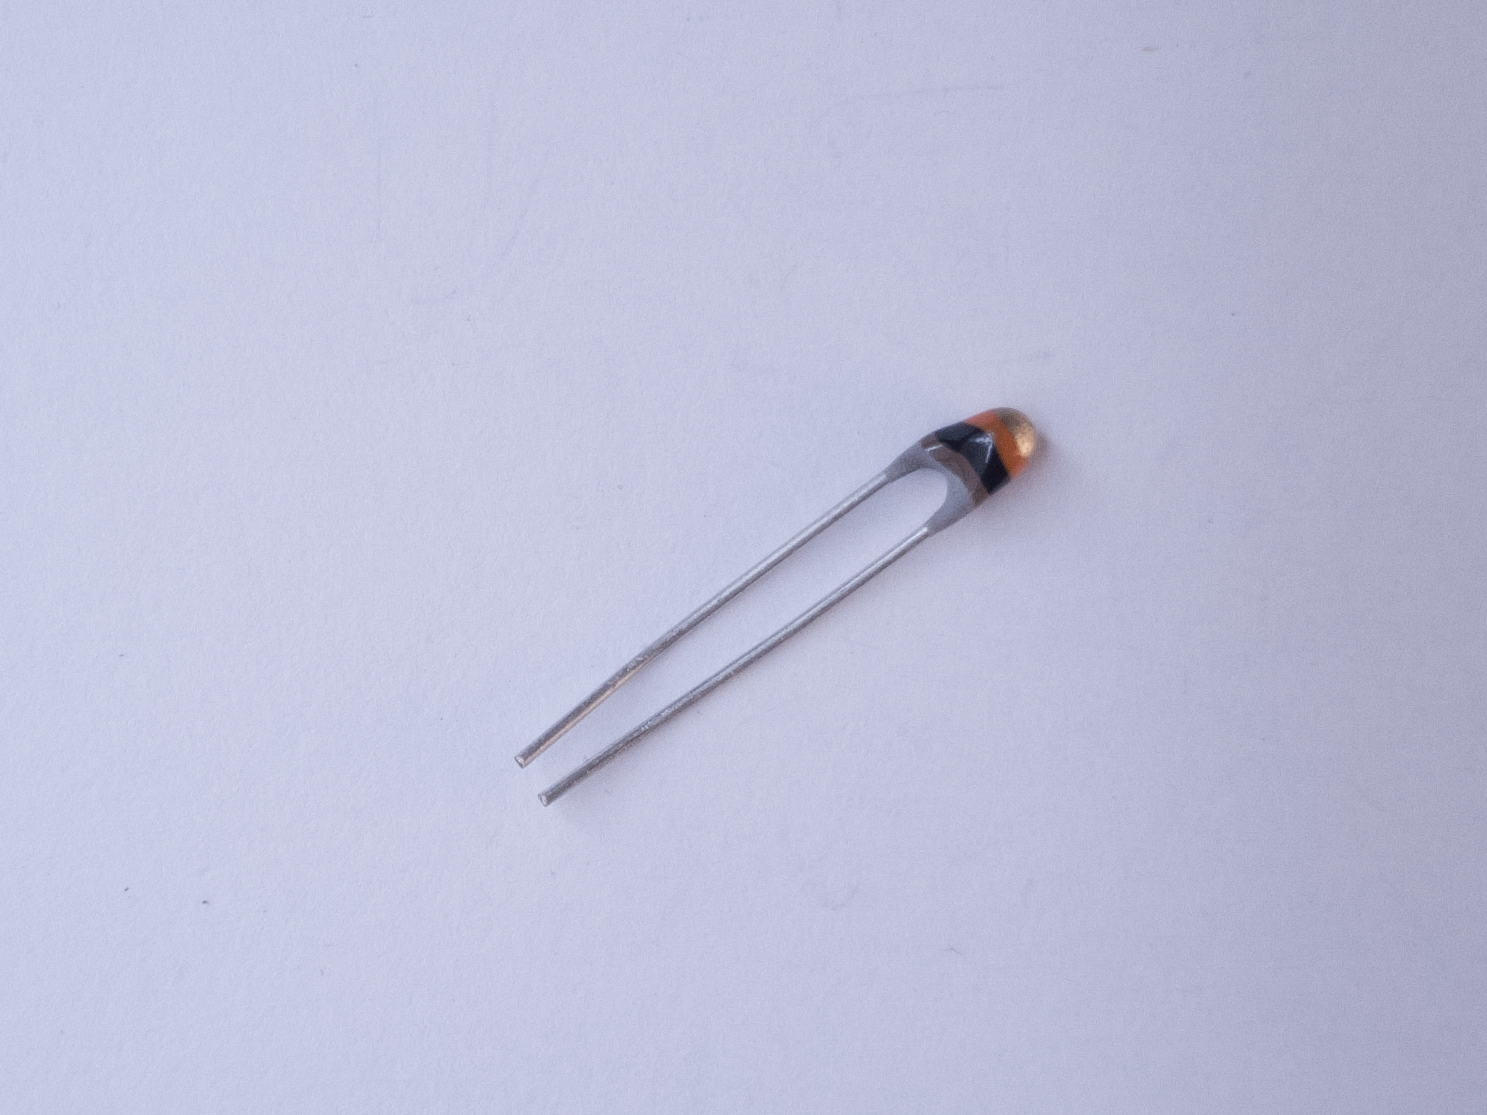
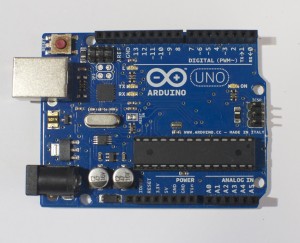
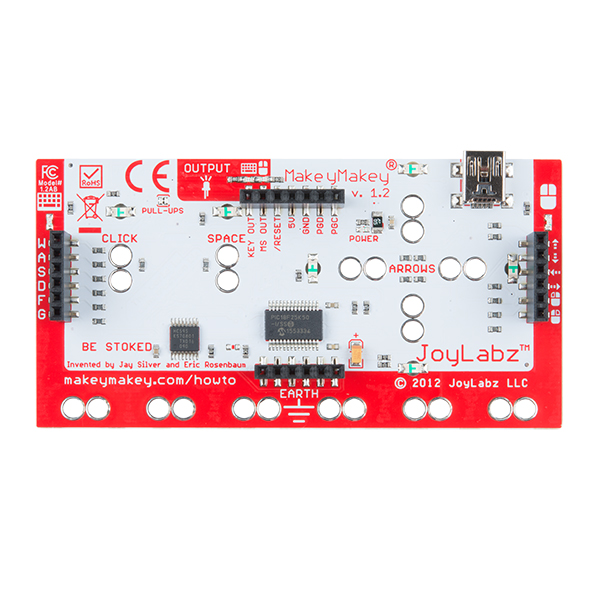
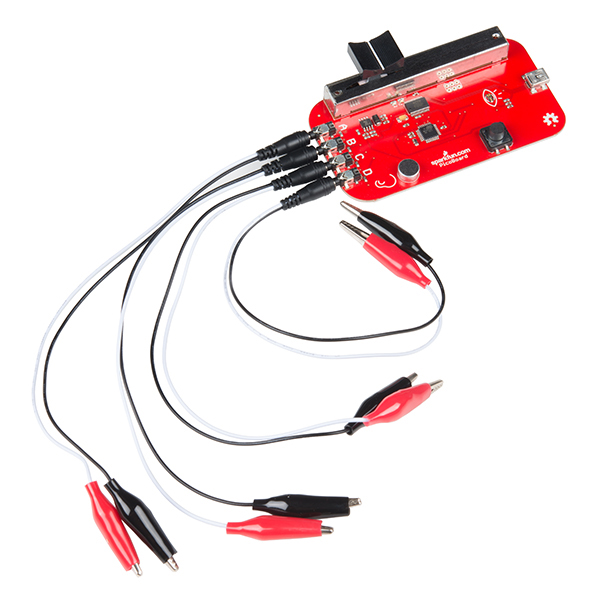
Figures 1-4 below show the parts you’ll need for this exercise. Click on any image for a larger view.
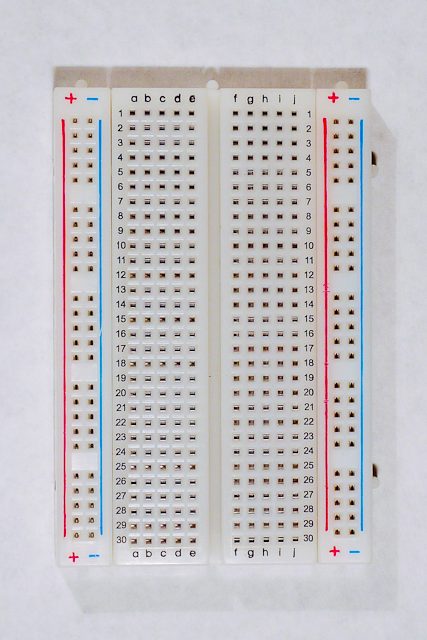
Prepare the Breadboard
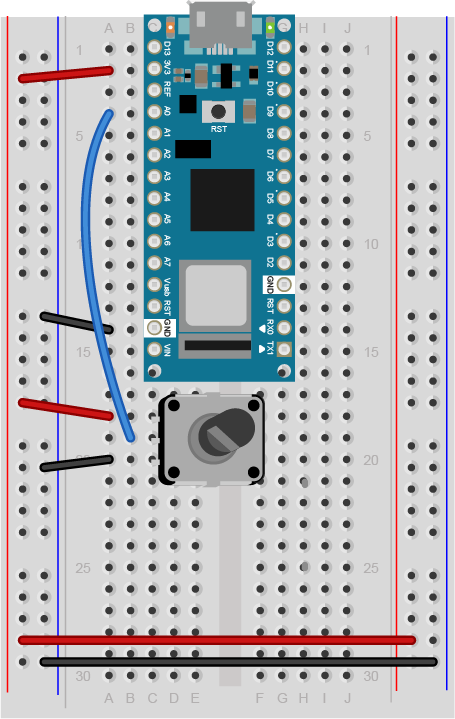
For this exercise you’re going to attach a potentiometer as an analog input to your microcontroller, and send the sensor’s reading serially to p5.js via the p5.serialcontrol app.
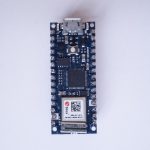
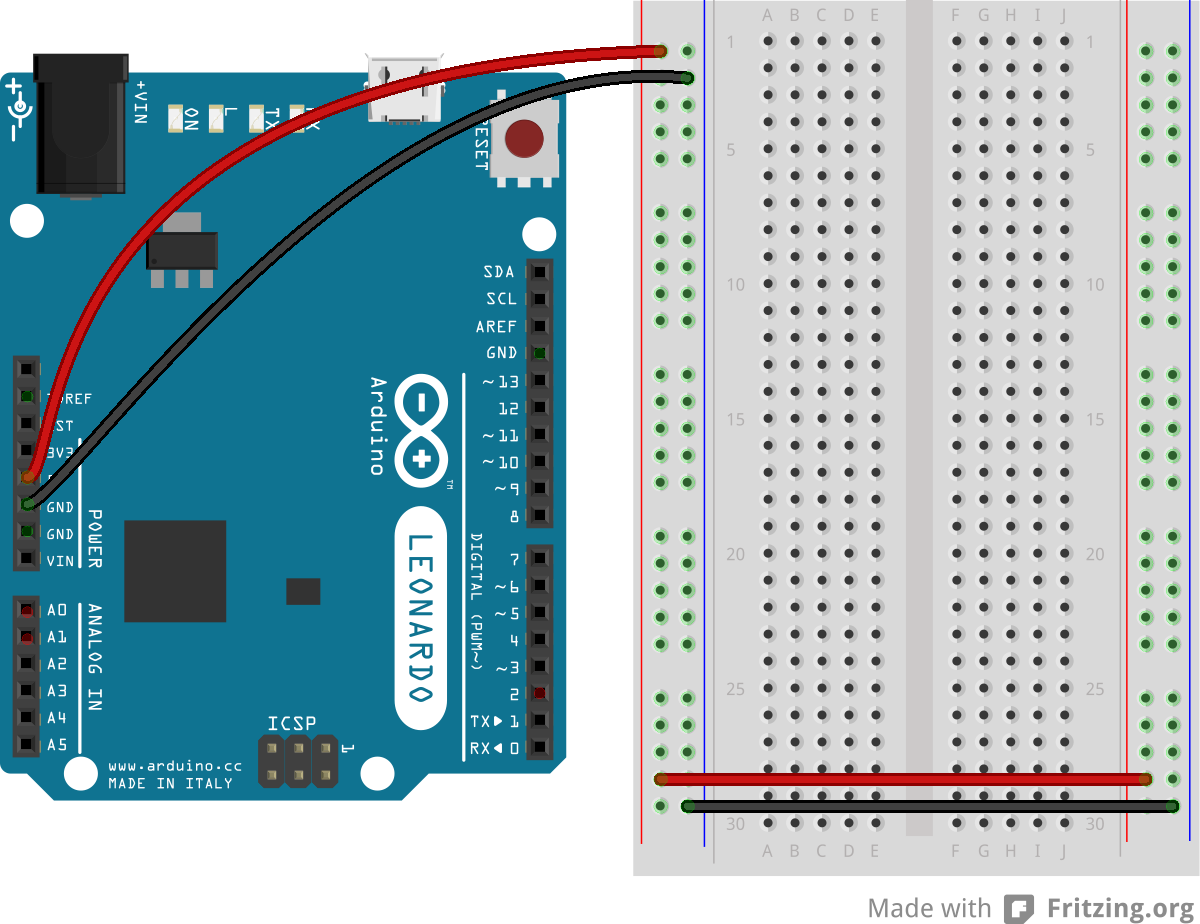
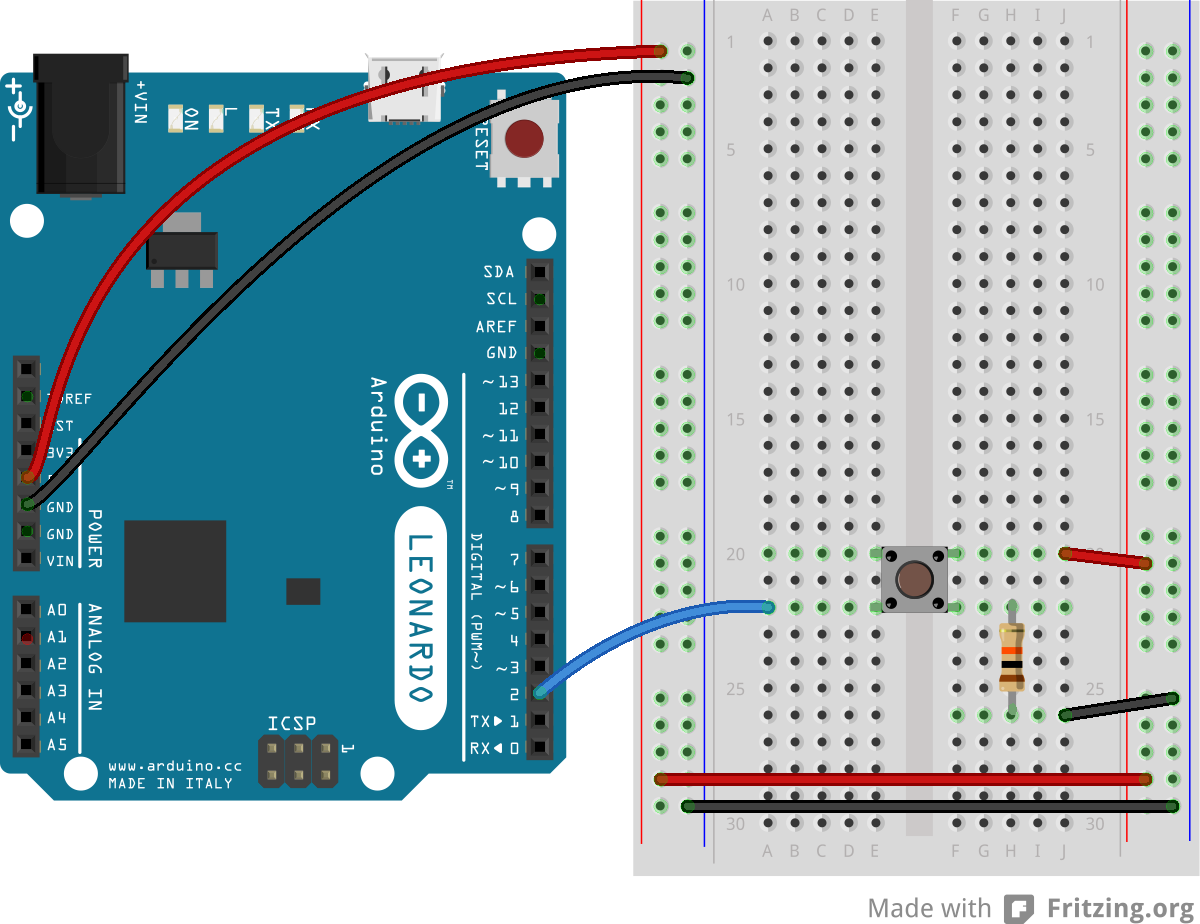
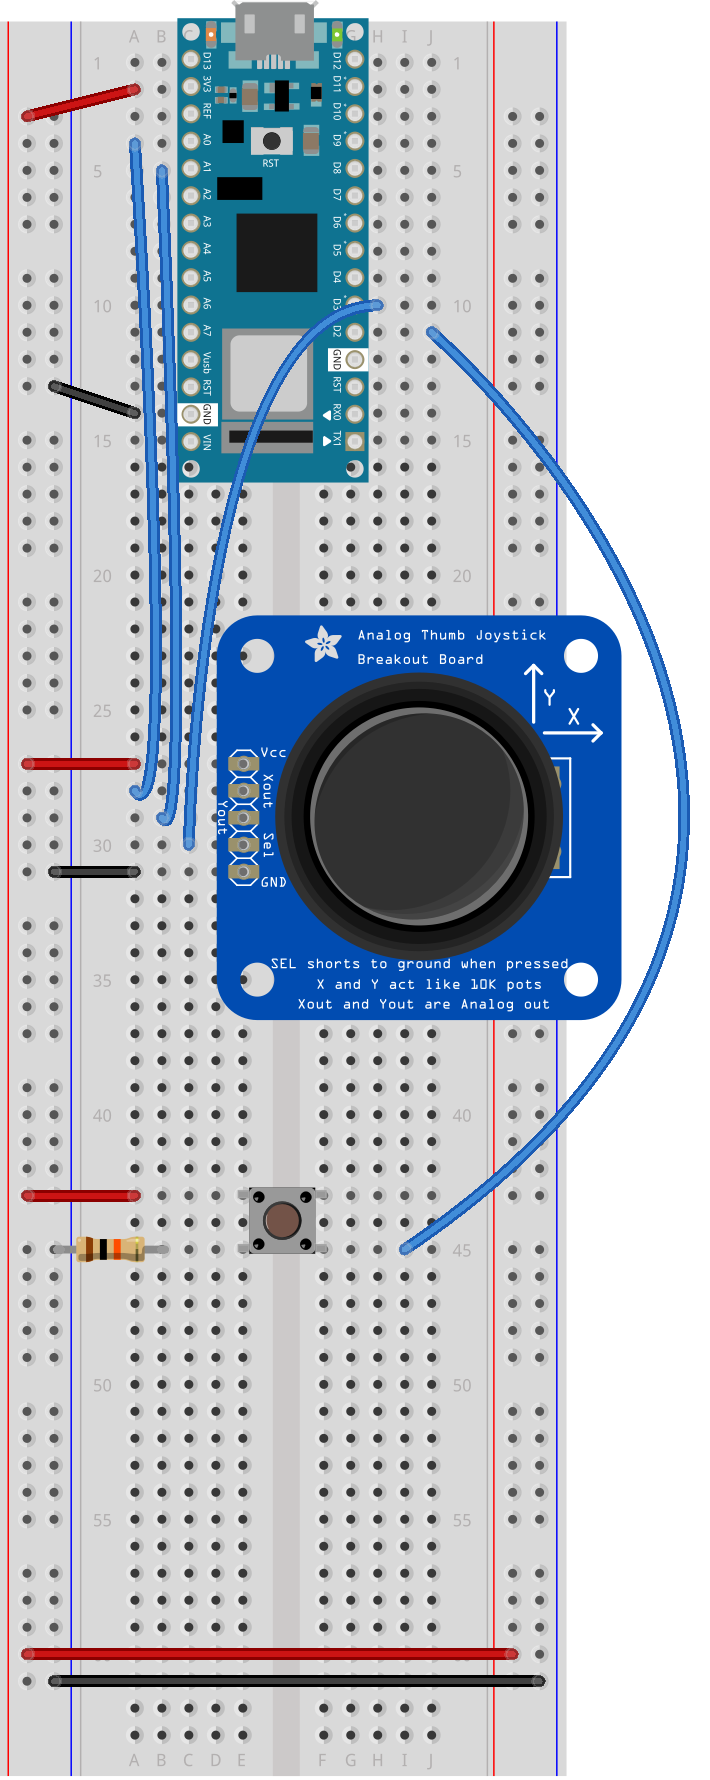
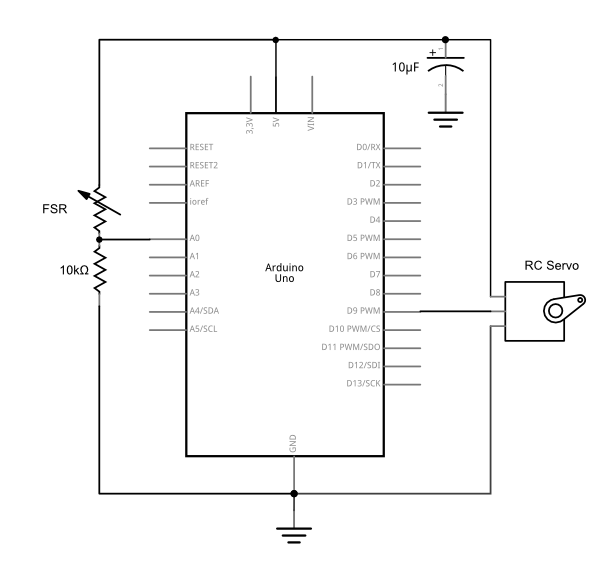
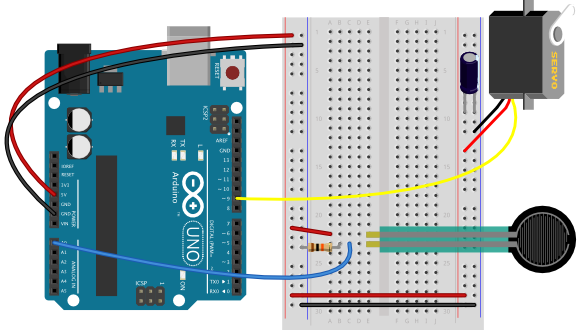
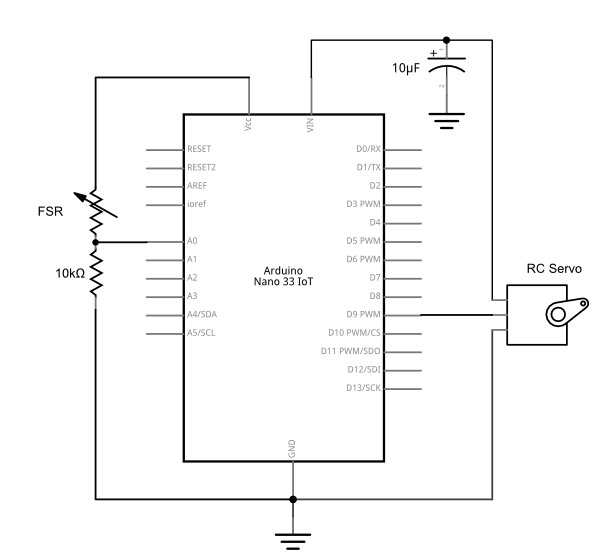
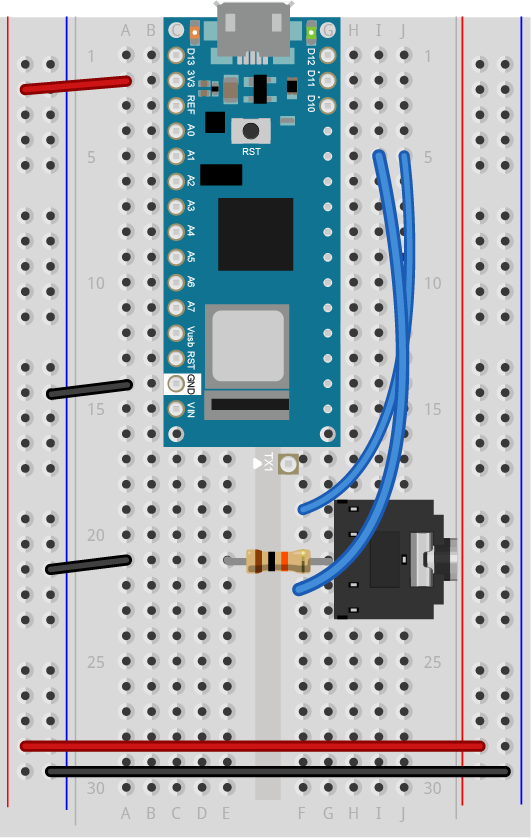
Connect power and ground on the breadboard to the microcontroller. On the Arduino module, use the 5V or 3.3V (depending on your model) and any of the ground connections. Figures 5 and 6 show connections for an Arduino Uno and a Nano, respectively.
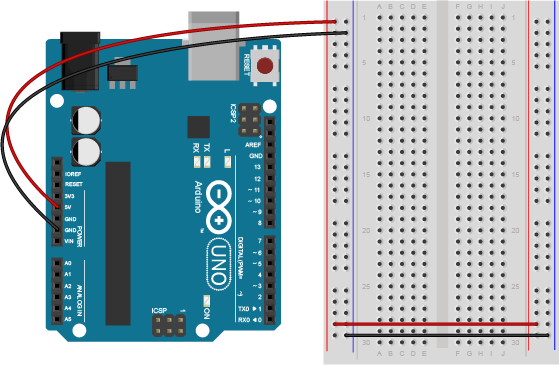
The Uno’s 5V output hole is connected to the red column of holes on the far left side of the breadboard (Figure 5). The Uno’s ground hole is connected to the blue column on the left of the board. The red and blue columns on the left of the breadboard are connected to the red and blue columns on the right side of the breadboard with red and black wires, respectively. These columns on the side of a breadboard are commonly called the buses. The red line is the voltage bus, and the black or blue line is the ground bus.
Images made with Fritzing, a circuit drawing application
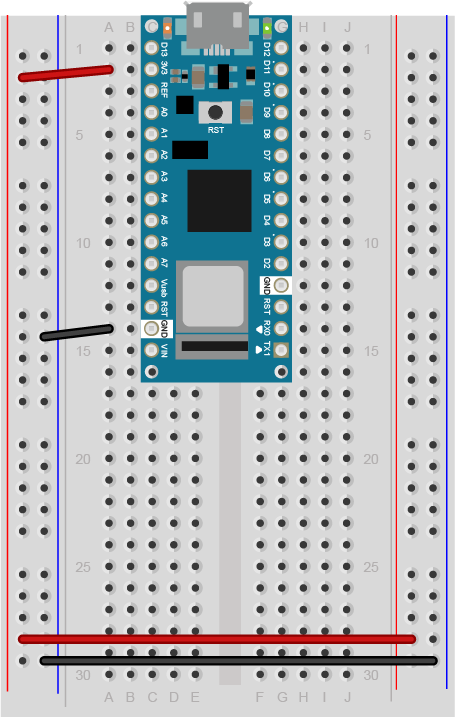
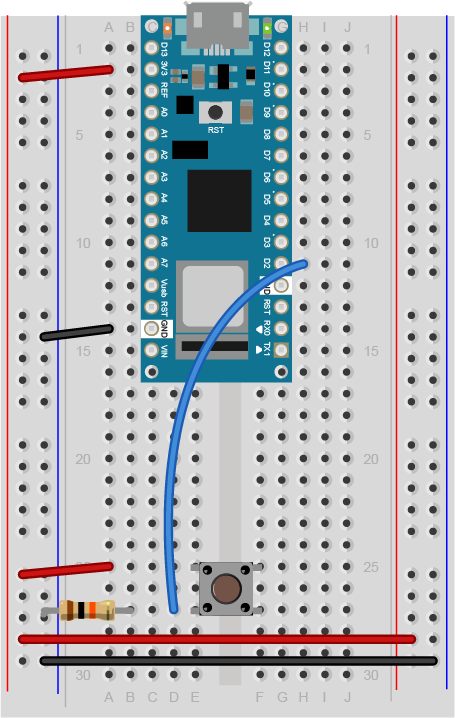
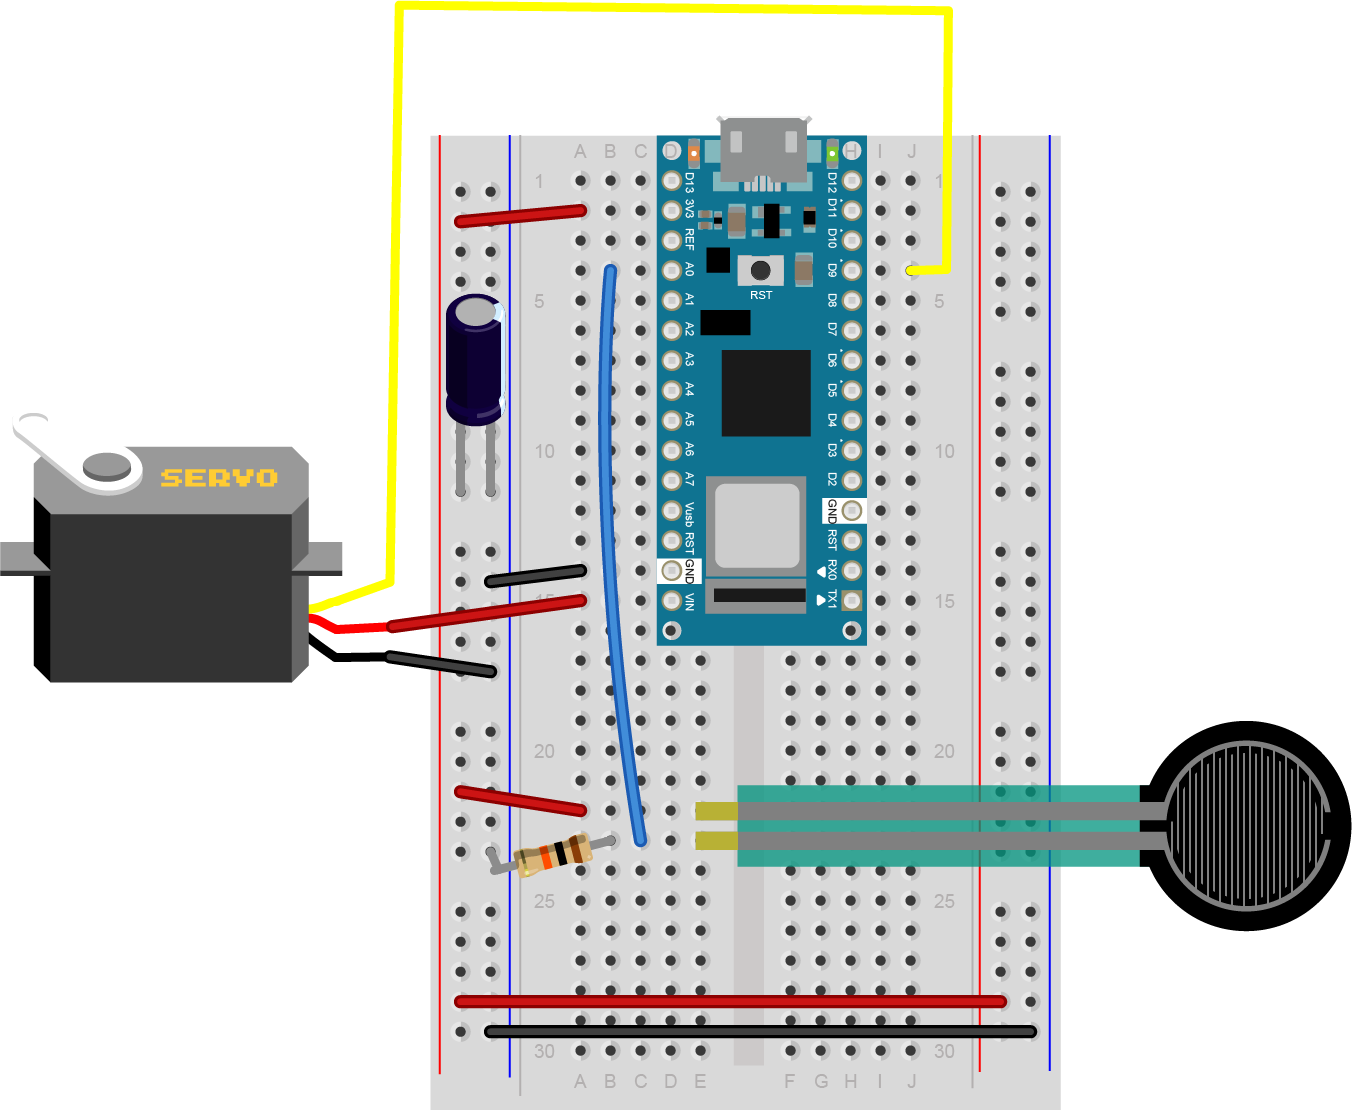
The Nano is mounted at the top of the breadboard (Figure 6), straddling the center divide, with its USB connector facing up. The top pins of the Nano are in row 1 of the breadboard.
The Nano, like all Dual-Inline Package (DIP) modules, has its physical pins numbered in a U shape, from top left to bottom left, to bottom right to top right. The Nano’s 3.3V pin (physical pin 2) is connected to the left side red column of the breadboard. The Nano’s GND pin (physical pin 14) is connected to the left side black column. These columns on the side of a breadboard are commonly called the buses. The red line is the voltage bus, and the black or blue line is the ground bus. The blue columns (ground buses) are connected together at the bottom of the breadboard with a black wire. The red columns (voltage buses) are connected together at the bottom of the breadboard with a red wire.
Add a Potentiometer
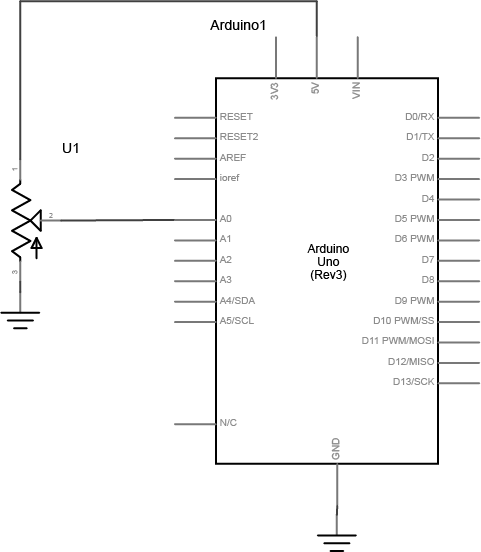
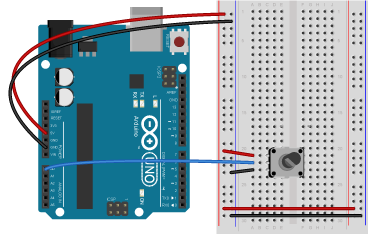
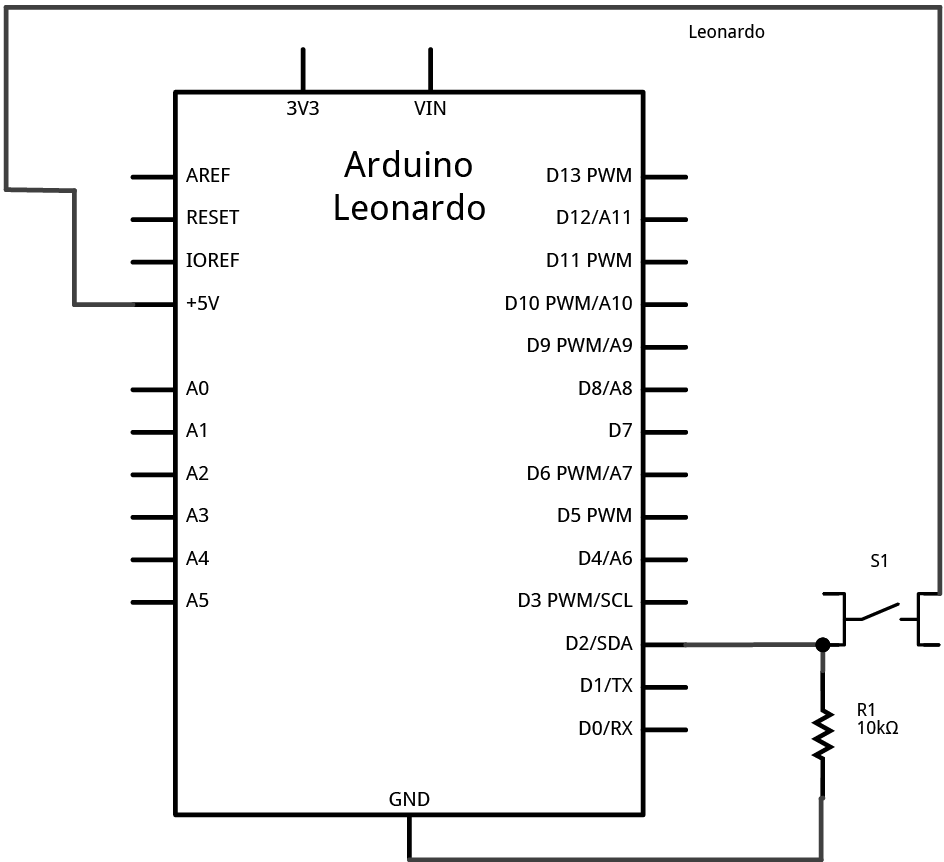
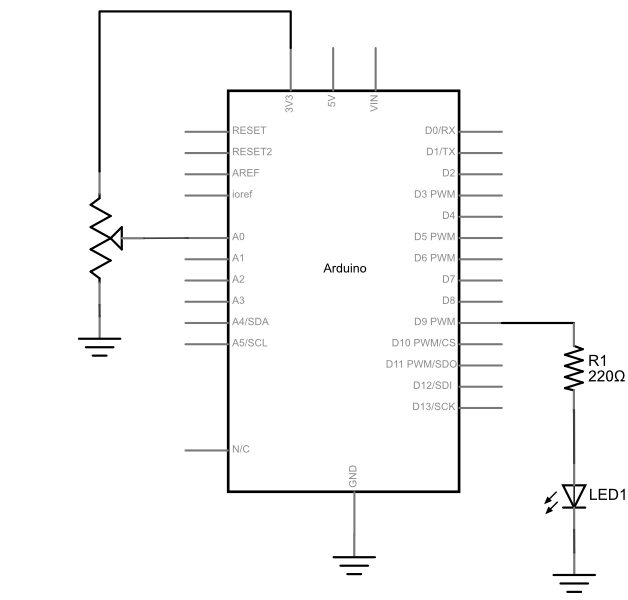
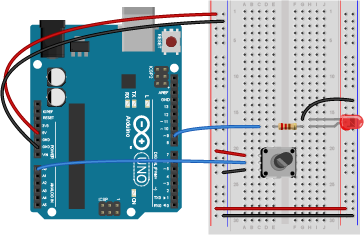
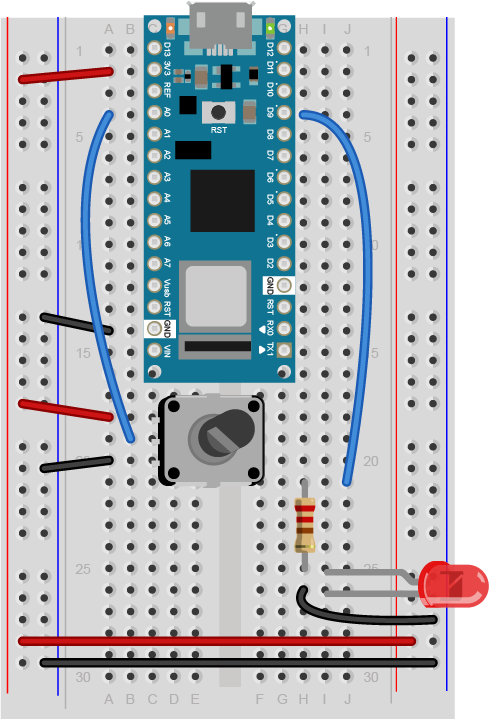
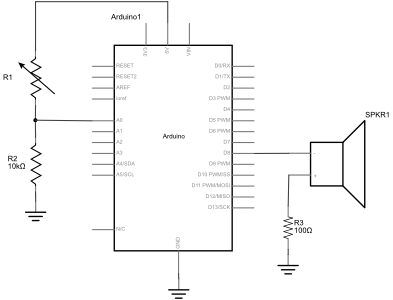
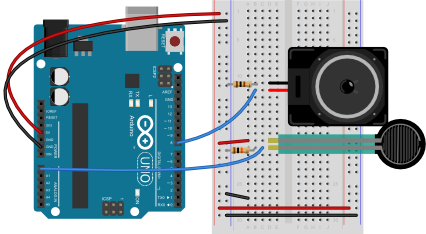
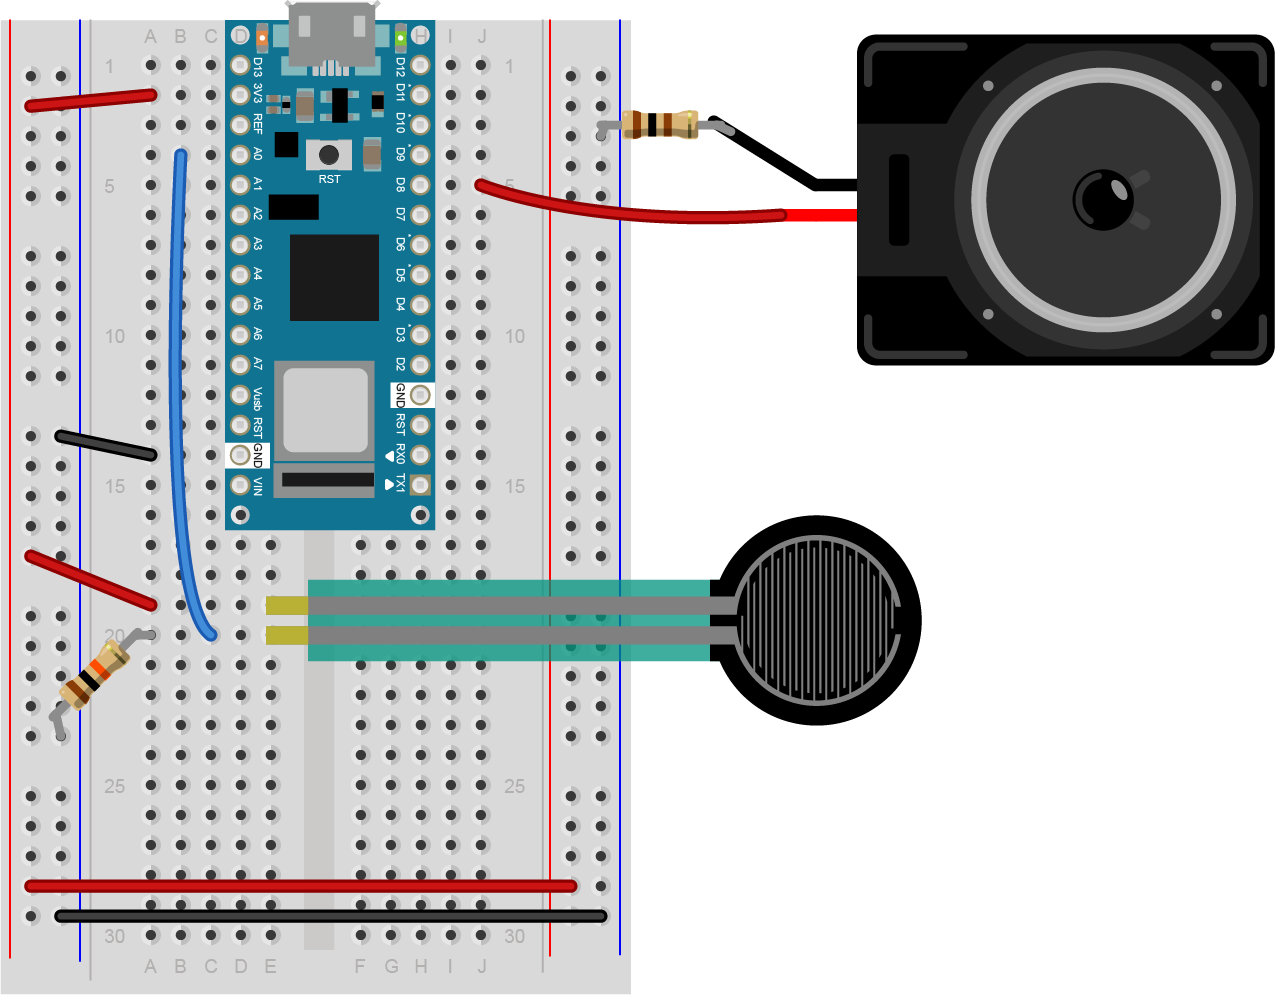
Connect a potentiometer to analog in pin 0 of the module. Figure 7 shows the schematic and figures 8 and 9 show the potentiometer connected to an Arduino and Nano, respectively.
Program the Microcontroller
Program your Arduino to read the analog input as follows:
void setup() {
  Serial.begin(9600); // initialize serial communications
}

void loop() {
  // read the input pin:
  int potentiometer = analogRead(A0);
  // remap the pot value to fit in 1 byte:
  int mappedPot = map(potentiometer, 0, 1023, 0, 255);
  // print it out the serial port:
  Serial.write(mappedPot);
  // slight delay to stabilize the ADC:
  delay(1);
}
Only one port at a time can access a serial port.
As you work on this any microcontroller-to-computer application, you will be switching back and forth between the app that programs the microcontroller (in this case, the Arduino IDE) and the app that the microcontroller is communicating with (in this case, p5.js in the browser). You have to keep in mind that only one of these at a time can access a serial port.
That means that when you want to reprogram your Arduino from the Arduino IDE, you should to stop your sketch in the browser window to do so. Then, restart the browser sketch when you’re done reprogramming the Arduino. You don’t need to quit the Arduino IDE each time, because it knows to release the serial port when it’s not programming. However, you do need to close the Serial Monitor in the Arduino IDE when you are using WebSerial in the browser.
The P5.js WebSerial Library
To communicate with your microcontroller serially, you’re going to use the P5.js WebSerial library. If you’re using the p5.js web editor, make a new sketch. Click the Sketch Files tab, and then choose the index.html file. In the head of the document, look for this line:
<script src="https://cdnjs.cloudflare.com/ajax/libs/p5.js/1.4.0/p5.js"></script>
Right after that line, add this line:
<script src="https://unpkg.com/p5-webserial@0.1.1/build/p5.webserial.js"></script>
The p5.js Sketch
To start off, you need to know if WebSerial is supported in the browser you’re using. Open the sketch.js file and change it to the following:
// variable to hold an instance of the p5.webserial library:
const serial = new p5.WebSerial();

function setup() {
   // check to see if serial is available:
   if (!navigator.serial) {
    alert("WebSerial is not supported in this browser. Try Chrome or MS Edge.");
  }
}
When you run this p5.js sketch in a browser, you’ll get a message letting you know whether or not this browser supports WebSerial. In a browser that supports WebSerial, you may want to delete the else clause.
Serial Events
JavaScript, the language on which p5.js is based, relies heavily on events and callback functions. An event is generated by the operating system when something significant happens, like a serial port opening, or new data arriving in the port. In your sketch, you write a callback function to respond to that event. The p5.webserial library uses events and callback functions as well. It can listen for the following serialport events:
- noport – when there is no selected serial port
- portavailable – when a serial port becomes available
- data – new data arrives in a serial port
- close – the serial port is closed
- requesterror – something goes wrong when you request a serial port.
The WebSerial API on which the p5.webserial library is based also has connect and disconnect events for when a serial port is physically disconnected (or in the case of a USB-native device like the Nano 33 IoT, when it is reset). You’ll see those below as well, and you’ll see them run whenever the serial connection to the Arduino is reset.
To use the the webserial library’s events, you need to set callback functions for them. Change your sketch to include a port chooser button and a variable for incoming data, then in the setup() function, add callbacks for open, close, and data, and error like so:
// variable to hold an instance of the p5.webserial library:
const serial = new p5.WebSerial();

// HTML button object:
let portButton;
let inData;                   // for incoming serial data
let outByte = 0;              // for outgoing data

function setup() {
  createCanvas(400, 300);          // make the canvas
  // check to see if serial is available:
  if (!navigator.serial) {
    alert("WebSerial is not supported in this browser. Try Chrome or MS Edge.");
  }
  // if serial is available, add connect/disconnect listeners:
  navigator.serial.addEventListener("connect", portConnect);
  navigator.serial.addEventListener("disconnect", portDisconnect);
  // check for any ports that are available:
  serial.getPorts();
  // if there's no port chosen, choose one:
  serial.on("noport", makePortButton);
  // open whatever port is available:
  serial.on("portavailable", openPort);
  // handle serial errors:
  serial.on("requesterror", portError);
  // handle any incoming serial data:
  serial.on("data", serialEvent);
  serial.on("close", makePortButton);
}

function draw() {


}
The draw() function is empty for the moment. You’ll come back and fill that in later.
Now that you’ve set listeners for the events, you need to add the callback functions. Here they are. Add these after the draw() function:
// if there's no port selected,
// make a port select button appear:
function makePortButton() {
  // create and position a port chooser button:
  portButton = createButton("choose port");
  portButton.position(10, 10);
  // give the port button a mousepressed handler:
  portButton.mousePressed(choosePort);
}

// make the port selector window appear:
function choosePort() {
  if (portButton) portButton.show();
  serial.requestPort();
}

// open the selected port, and make the port
// button invisible:
function openPort() {
  // wait for the serial.open promise to return,
  // then call the initiateSerial function
  serial.open().then(initiateSerial);

  // once the port opens, let the user know:
  function initiateSerial() {
    console.log("port open");
  }
  // hide the port button once a port is chosen:
  if (portButton) portButton.hide();
}

// pop up an alert if there's a port error:
function portError(err) {
  alert("Serial port error: " + err);
}
// read any incoming data as a string
// (assumes a newline at the end of it):
function serialEvent() {
  inData = Number(serial.read());
  console.log(inData);
}

// try to connect if a new serial port
// gets added (i.e. plugged in via USB):
function portConnect() {
  console.log("port connected");
  serial.getPorts();
}

// if a port is disconnected:
function portDisconnect() {
  serial.close();
  console.log("port disconnected");
}

function closePort() {
  serial.close();
}
Wait a Minute! Don’t I have to Set the Data Rate When I Open the Port?
In asynchronous serial communications, both computers have to set the same data rate in order to communicate. In Arduino, you set the data rate with Serial.begin(9600); In p5.webserial, 9600 bits per second is the default, so you don’t have to set the rate if you want 9600bps. But if you want to set the rate to another value, change your serial.open() call in the openPort() function as follows:
let options = { baudrate: 9600}; // change the data rate to whatever you wish
serial.open(portName, options);
There are other port options you can set using p5.webserial, including baudRate, bufferSize, dataBits, flowControl, parity and stopBits. These are all standard serialport options, and most programming environments which support serial communication will have them. You can get details of these in the p5.webserial documentation.
p5.WebSerial Sketch Checklist
Most p5.WebSerial sketches that you write will have a similar structure to this one. The main difference between them all will be how you read and interpret incoming serial data, and how and when you send and format outgoing serial data. Here’s a checklist of the pieces you’re likely to see in every sketch:
- In the HTML file, include the p5.webserial library
- In the global variables of the sketch,
- make a new instance of the library
- include a port selector button or some way to invoke the serial port chooser dialogue box
- In the setup:
- Make sure WebSerial is supported in this browser
- Include a call to
serial.getPorts()to check for available ports. - include
serial.on()listeners for these events:- noport
- portavailable
- data
- close
- requesterror
- include navigator listeners for connect and disconnect
- Define handler functions for all of the events above. Most of these can be simple alerts or console.log messages
- Customize the function that responds to the
datalistener (usually calledserialEvent()in these examples), as you’ll see below. - Decide when and how you’ll send serial data out, as you’ll see in the other p5.webserial labs.
The last two items of this list are the ones on which you’ll spend most of your time. The rest of the items are things you’re likely to copy from one sketch to another.
Reading Incoming Serial Data
The event that that you’ll use the most is the data event, which calls the serialEvent() function. Each time a new byte arrives in the serial port, this function is called. Now it’s time to make serialEvent() do some work. Add a new global variable at the top of your sketch called inData like so:
The serialEvent() function you added above looks like this:
function serialEvent() {
  inData = Number(serial.read());
  console.log(inData);
}
It’s reading the incoming data byte by byte, and interpreting each byte as a number. That’s why the Number() function surrounds the read() function. Since you’re sending the data from the Arduino as a binary value (using the Serial.write() function), you have to interpret it in p5.js as a binary value as well.
Next, make the draw() function to print the sensor value to the screen like so:
function draw() {
   background(0);
   fill(255);
   text("sensor value: " + inData, 30, 50);
}
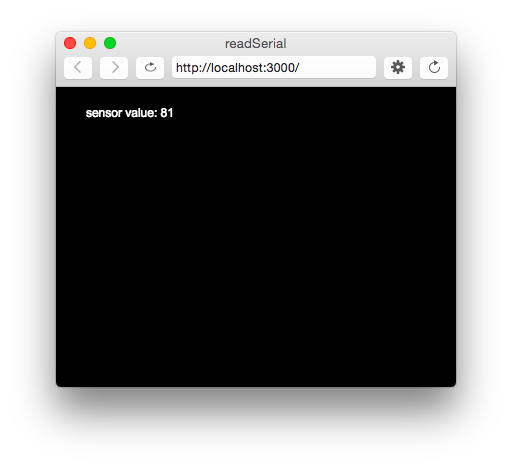
When you run your sketch now, you should get something like the sketch shown in Figure 10.
To see the sketch running on GitHub at this link. You can see the source files for copying into the p5.js editor at this link.
The sensor value onscreen should change as you turn your potentiometer. Congratulations! You’ve got P5.js talking to your microcontroller.
What’s Happening Here
Every time your microcontroller sends a byte serially using Serial.write(), the computer receives it and generates a ‘data’ event. Then your serialEvent() function is called. It reads the byte as a number, and stores it in the global variable inData. The draw() method just uses the latest value of inData in the text string it displays on the screen.
You may be wondering why you’re mapping the sensor value or dividing it by 4 in the Arduino sketch above. That’s because in order to send the sensor value as a single byte, it must be between 0 and 255, or no more than 28 bits.
P5.js Console.log() and Arduino delay(): a Tricky Combination
In testing this, you may have put a console.log() statement in the serialEvent() function in your P5.js sketch. When you did, you would have noticed that it causes a lag in the sketch, and the console.log() statements continue even after you stop the sketch. This is because the operating system keeps the incoming serial data in a buffer, and P5.js isn’t reading and printing it as fast as Arduino is sending it.
You might think, “Okay, then I’ll just put a delay() in my Arduino sketch to slow it down.” That’s a bad idea. When you put in a delay, it means you’re only reading your sensor when that delay is not running. You can miss critical sensor events while that delay is in progress. Even a relatively small delay, for example 30ms, can make it difficult to reliably read state changes in a switch or peaks in an analog sensor. Don’t use delays if you can avoid it. For more on how to handle the flow of serial data from Arduino to P5.js and back, see the Duplex Serial Flow using WebSerial in P5.js lab.
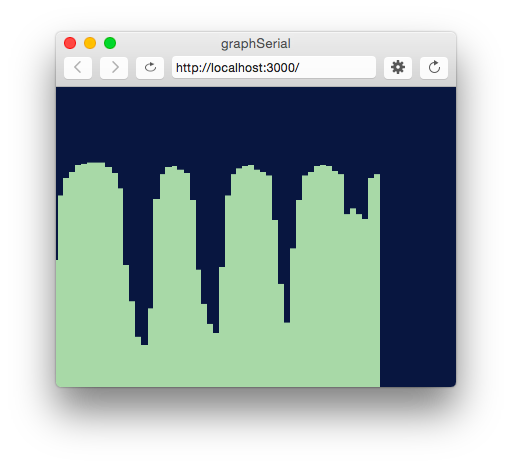
Draw a Graph With the Sensor Values
It would be useful to see a graph of the sensor values over time. You can do that by modifying the draw() method to draw the graph. To do this, add a new global variable at the top of your sketch called xPos. You’ll use this to keep track of the x position of the latest graph line:
let xPos = 0; // x position of the graph
Because of the way the graphing function below works, you can’t reset the background every time through the draw() loop. So take the background() command and put it in the setup() function instead of the draw(), as shown below. That way it runs once, then not again. As long as you’re at it, switch from black & white to a nice blue color:
function setup() {
  createCanvas(400, 300);
  background(0x08, 0x16, 0x40);
Now make a new function called graphData(). It’ll take a number value as a parameter, and it will draw a line on the screen that’s mapped to the number value. Then it will increment xPos so that the next line is drawn further along. It will also check if the xPos is at the right edge of the screen, and reset the screen by calling background() again if it is:
function graphData(newData) {
  // map the range of the input to the window height:
  var yPos = map(newData, 0, 255, 0, height);
  // draw the line in a pretty color:
  stroke(0xA8, 0xD9, 0xA7);
  line(xPos, height, xPos, height - yPos);
  // at the edge of the screen, go back to the beginning:
  if (xPos >= width) {
    xPos = 0;
    // clear the screen by resetting the background:
    background(0x08, 0x16, 0x40);
  } else {
    // increment the horizontal position for the next reading:
    xPos++;
  }
}
Finally, take everything out of the draw() function and just call graphData() from there:
function draw() {
  graphData(inData);
}
When you run the sketch now, you should get a graph, as shown in Figure 11.
To see the sketch running on GitHub at this link. You can see the source files for copying into the p5.js editor at this link.
Reading Serial Data as a String
This works well if you want to read your sensor values as a single byte, but what if you want a larger range of numbers? What if you want the full 0 to 1023 that analogRead() can output instead of just 0 to 255? To do this, you need to send the data as an ASCII-encoded numeric string from the microcontroller, and you need to read and interpret the incoming data in P5 as an ASCII-encoded numeric string as well.
Change your Arduino program to the following:
void setup() {
 Serial.begin(9600); // initialize serial communications
}

void loop() {
 int potentiometer = analogRead(A0);                  // read the input pin
 int mappedPot = map(potentiometer, 0, 1023, 0, 255); // remap the pot value to fit in 1 byte
 Serial.println(mappedPot);                           // print it out the serial port
 delay(1);                                            // slight delay to stabilize the ADC
}
Now it will print the potentiometer’s value as an ASCII-encoded numeric string, and it will add a carriage return byte and a newline byte at the end, because that’s what println() does.
Once you’ve uploaded this to your Arduino, run your P5 sketch again. Try adding println(inData); at the end of your serialEvent() function. When your P5 sketch reads the data from this Arduino program, you get very low values, and every so often you see the value 10 followed by the value 13. What’s going on?
When a computer ASCII-encodes a number, it converts that number to a string of bytes, each of which is the ASCII value for a numeral in the number. For example, the number 865 gets converted to three bytes, as shown in Figure 12.

If there’s a carriage return byte and a newline byte after this, the string is five bytes, and the last two bytes’ values are 13 (carriage return, or \r in most programming languages) and 10 (newline or \n in most programming languages), respectively.
Your P5.js sketch is reading every byte’s value and graphing it. That’s why you get a graph of very low values, with a bunch of them being 13 and 10. The Arduino is ASCII-encoding the potentiometer values, but the P5 sketch is interpreting the bytes as if they’re not encoded that way.
Now change the serialEvent() function like so:
function serialEvent() {
  // read a byte from the serial port, convert it to a number:
  inData = serial.readLine();
}
Run it again. What’s changed? Now you’re getting a graph kind of like you were before. The serial.readLine(); command reads the incoming serial data as a string, and when that string happens to be all-numeric, it converts it to a number. So you’re getting the ASCII-encoded string as a number again. But sometimes there are gaps. Why?
Remember, the ‘data’ event occurs every time a new byte comes in the serial port. Now that you’re sending an ASCII-encoded string, every potentiometer reading is several bytes long. So you only get a complete string every three to six bytes (three for “0\r\n” and six for “1023\r\n”). Sometimes, when the serialEvent() function calls serial.readLine(); it gets nothing. That’s when draw() draws the gaps. You need to change your function to check that the resulting string is actually a valid number before you put the string into inData. First, create a local variable to get the string, then check to see if the string’s length is greater than zero. If it is, then put it into inData so that the other functions in the sketch can use the new data. Here’s how you do that:
function serialEvent() {
  // read a string from the serial port:
  var inString = serial.readLine();
  // check to see that there's actually a string there:
  if (inString) {
  // convert it to a number:
  inData = Number(inString);
  }
}
Now you’re able to send in a number of any value to P5.js. You don’t have to limit your input to a 0-255 value range. See if you can modify the Arduino sketch and the P5.js sketch to exchange a potentiometer value that spans the whole range from 0 to 1023.
note: readLine() is the same as readStringUntil(‘\r\n’);
You can see the sketch running on GitHub at this link. You can see the source files for copying into the p5.js editor at this link.
Conclusion
In this lab, you saw how to connect an Arduino microcontroller to a P5.js sketch using a webSocket-to-serial server, P5.serialserver, and the P5.serialport library. You sent data from Arduino to the sketch as a raw binary value — that is, a single byte ranging from 0 to 255 — and you sent it as an ASCII-encoded numeric string with a carriage return and newline at the end. See Table 1 below to review what are suitable data formats for different types/sizes of data and which functions to use on p5.js and Arduino for serial communication.
| Data to Send | within 0-255 (< 2^8 = 1 byte) | Multiple values |
|---|---|---|
| Send as: | ||
| Arduino -> | ||
| -> p5.js | =readStringUntil('\r\n') |
Table 1. Serial Communication: Arduino to p5.js
Notes about sending ASCII-encoded data:
- Using
Serial.println()on Arduino andserial.readLine()on p5.js is one of many different ways of sending data from Arduino to p5.js via serial communication. - If you want to read an ASCII-encoded numeric string as a number and not a string, convert the value into number by using
Number().
Understanding the difference between ASCII-encoded strings and raw binary data is central to all serial communications. For more examples of this in action, see the WebSerial Output from P5.js lab.


